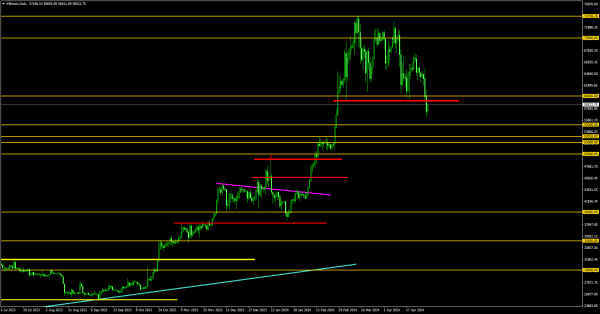
Interesting developments are unfolding on the Bitcoin chart. Yesterday, we witnessed an impulsive breakthrough of the support zone at 60000-59000. As a result, the price managed to reach a low of 56367 before bouncing back. It is currently unclear whether this pullback will result in a retest of the broken support at 60000 or if the price will be able to reclaim this key level. If a retest occurs from below, we can expect a continuation of the downtrend, potentially targeting the next significant support around 53-53 thousand per coin. However, if by the end of the week the price manages to climb back above 60000 and hold above it, it would indicate a false breakout aimed at shaking out weak hands before resuming the uptrend within the overall bullish trend. At the moment, I am leaning towards a scenario suggesting a probable continuation of the correction.
*El análisis de mercado publicado aquí está destinado a aumentar su conocimiento, pero no a dar instrucciones sobre cómo realizar una operación
 Español
  Русский
 English
 Bahasa Indonesia
 Bahasa Malay
 ไทย
ไทย Deutsch
 Български
 Français
 Tiếng Việt
 中文
中文 বাংলা
বাংলা हिन्दी
 Čeština
 Українська
 Română