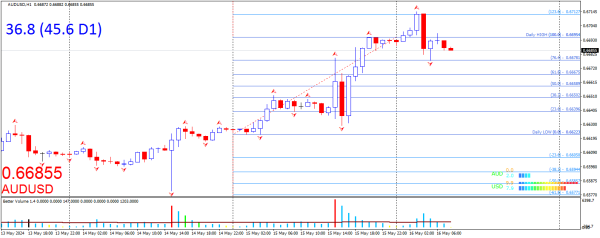
Movement of AUDUSD according to Fibonacci levels. A bullish scenario is emerging for this instrument. The market movement is within the Fibonacci range, between the levels 100-0.66954 and 50-0.66589, with the current price at 0.66857. Using the extremes of the previous day allows for setting up a Fibonacci grid on them. This construction results in the range of 100-0.66954 and 50-0.66589. The presence of the current price 0.66857 in this bullish corridor indicates a northward movement. Based on this information suggesting market growth, I am looking for entry points from the target levels 50-0.66589, 61.8-0.66675, 76.4-0.66781. From these levels, one can trade both on a bounce and a breakout. I aim to take profit at the upper levels 123.6-0.67127 or 138.2-0.67233, which would be greatly appreciated. It is possible that things may not go as planned, and bears may show interest, leading the market below the range, specifically below the level 50-0.66589. One should not fear this bearish situation but instead be flexible and switch to selling. Fibonacci grid can be constructed in various ways. My decision was to attach it to the daily candle, simplifying the setup without any market errors.
*Analisis pasaran yang dipaparkan di sini hanya bertujuan untuk meningkatkan kesedaran anda, tetapi bukan sebagai petunjuk untuk anda melakukan perdagangan
 Bahasa Malay
  Русский
 English
 Bahasa Indonesia
 ไทย
ไทย Español
 Deutsch
 Български
 Français
 Tiếng Việt
 中文
中文 বাংলা
বাংলা हिन्दी
 Čeština
 Українська
 Română
Ulasan: