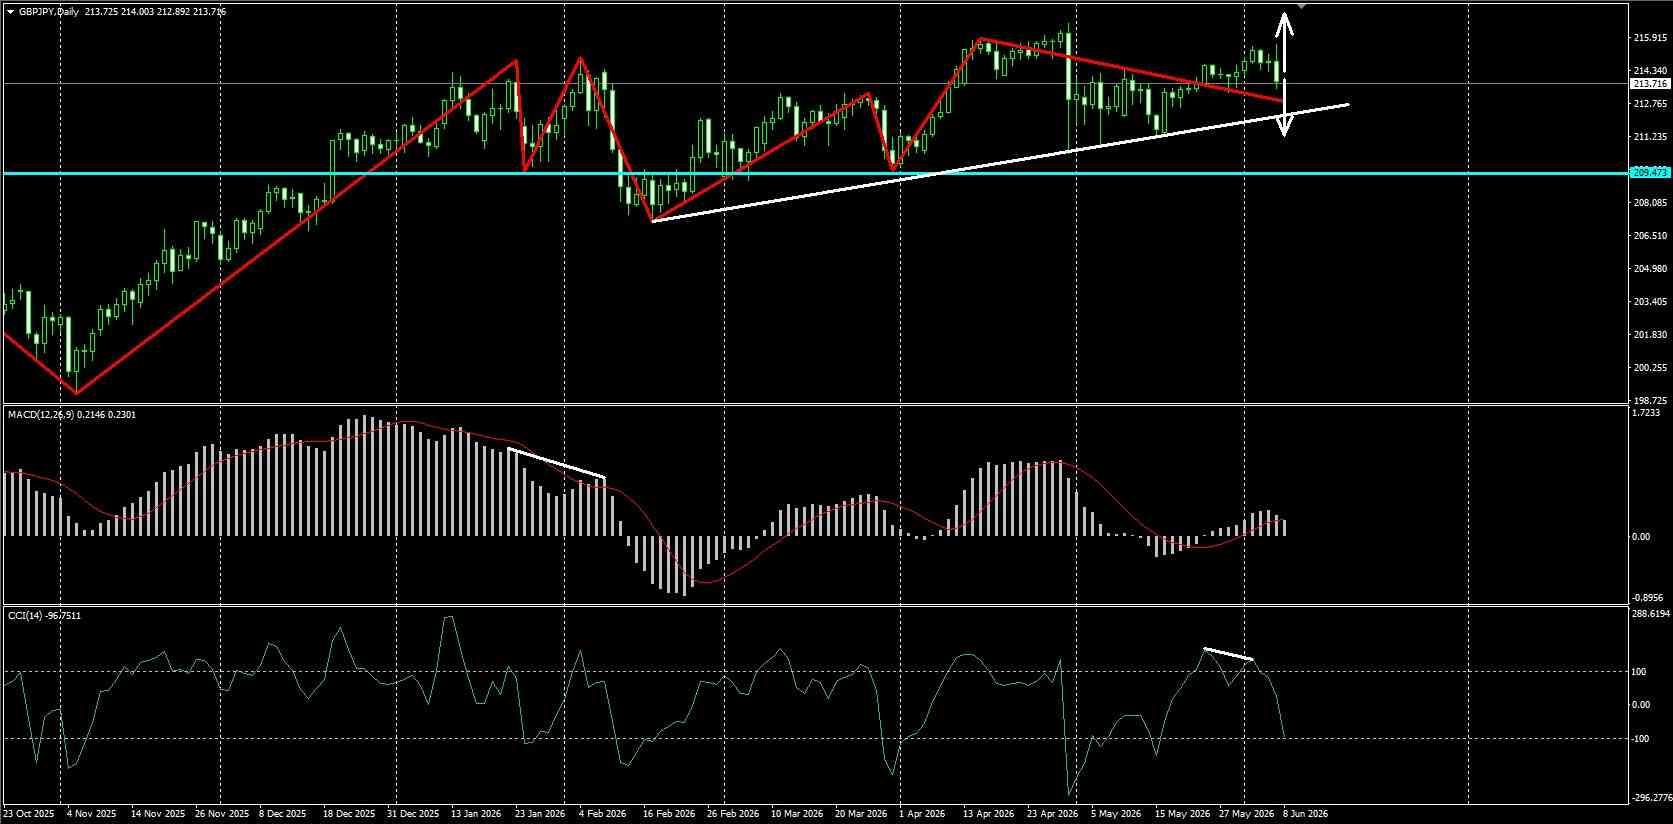
D1 chart - GBPJPY currency pair. On this higher timeframe, the wave structure is forming an upward pattern. The MACD indicator is in the overbought zone, but already below its signal line. The gradual growth that has been happening here looks technically justified. In February, there was a downward wave that renewed the previous low and managed to stay below the support level of 209.47. The price lingered below that level for many days in a row, apparently accumulating sellers. Without letting them profit, the level was broken upwards again and changed its status to support. There was a return to it and then growth. I expected the growth to surpass the highs of January and February, as they are almost at the same level. March turned out to be mostly sideways, giving hope to sellers with a decline towards the end. Once again, a strong level of 209.47 blocked the price from going further down. In April, the price was pushed up again and eventually surpassed the previous highs. This was followed by profit-taking and new sales, as the area above the peaks was a potential selling zone. Now, there is a horizontal support level at 213.22 in the price's path. It could very well become a base for a new rise with a new high, as the overall uptrend is still intact. If sellers manage to push the price below this level, there is another obstacle on the way down - an ascending trendline drawn from the nearest wave lows. Of course, the growth cannot continue indefinitely, and on the highest monthly timeframe, there is a bearish divergence on the MACD, a very rare occurrence considering the scale of that large monthly chart. Similarly, on the weekly timeframe, there is now a divergence after the peak was reached. All these signals for a decline played out with a sharp drop of over 600 points on the last day of April. Now, the situation is unclear, as after such a drop, the price may get stuck in a sideways movement for a couple of weeks. There is an ascending trendline and the level of 213.22, which is more of an expanded support zone. At the same time, the divergences on the monthly and weekly charts do not add optimism for buying. For now, my view on the pound in the market leans more towards a decline, and some decline seemed to start here as well, but everything was pushed back to the middle, showing no clear direction. It seems like the inclination is more towards a downside move. However, the position of the CCI indicator is concerning, as it recently moved down from the overbought zone with a bearish divergence visible. The price was pushed back to the middle again, creating uncertainty. Conclusion - it's better to stay out of the market for this pair at the moment.
* Phân tích thị trường được đăng ở đây nhằm mục đích nâng cao nhận thức của bạn, nhưng không đưa ra hướng dẫn để thực hiện giao dịch
 Tiếng Việt
  Русский
 English
 Bahasa Indonesia
 Bahasa Malay
 ไทย
ไทย Español
 Deutsch
 Български
 Français
 中文
中文 বাংলা
বাংলা हिन्दी
 Čeština
 Українська
 Română