AUDCAD M15
Double Bottom
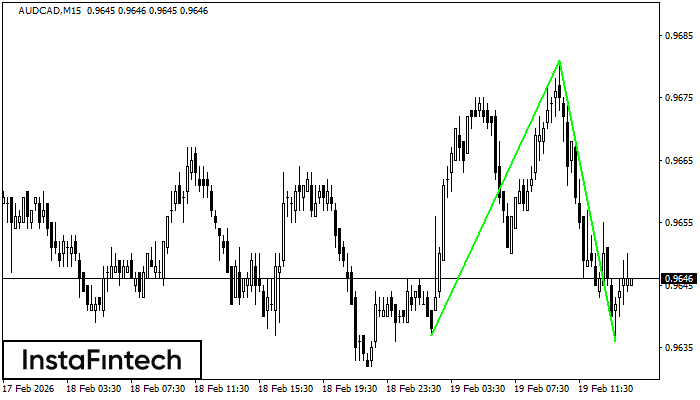
The Double Bottom pattern has been formed on AUDCAD M15. Characteristics: the support level 0.9637; the resistance level 0.9681; the width of the pattern 44 points. If the resistance level is broken, a change in the trend can be predicted with the first target point lying at the distance of 45 points.
NZDCHF M15
Bullish Symmetrical Triangle
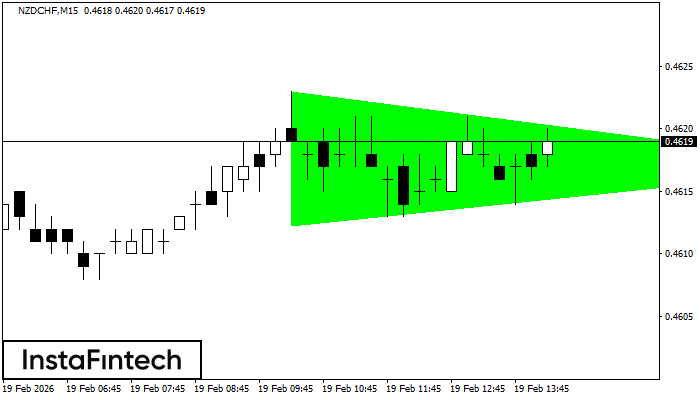
According to the chart of M15, NZDCHF formed the Bullish Symmetrical Triangle pattern. Description: This is the pattern of a trend continuation. 0.4623 and 0.4612 are the coordinates of the upper and lower borders respectively. The pattern width is measured on the chart at 11 pips. Outlook: If the upper border 0.4623 is broken, the price is likely to continue its move by 0.4640.
GBPAUD M30
Bearish Symmetrical Triangle
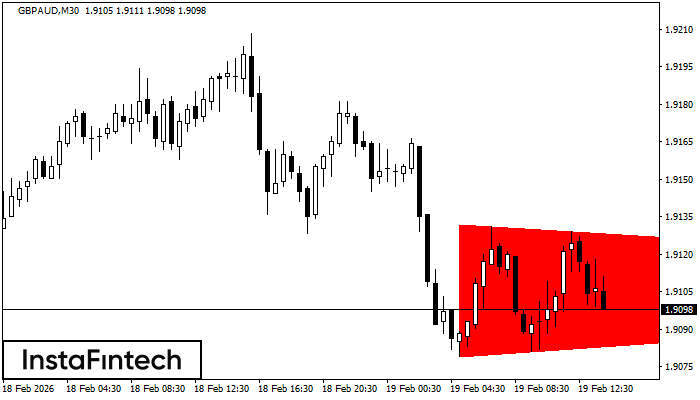
According to the chart of M30, GBPAUD formed the Bearish Symmetrical Triangle pattern. This pattern signals a further downward trend in case the lower border 1.9079 is breached. Here, a hypothetical profit will equal the width of the available pattern that is -53 pips.
GBPUSD M5
Bearish Flag
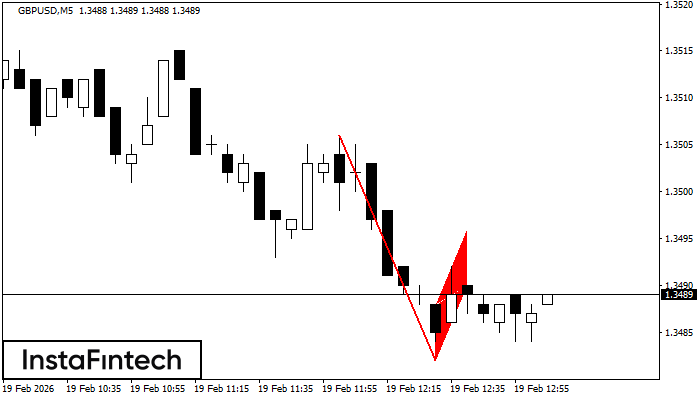
The Bearish Flag pattern has been formed on GBPUSD at M5. The lower boundary of the pattern is located at 1.3482/1.3490 while the upper boundary lies at 1.3488/1.3496. The projection of the flagpole is 24 points. This formation signals that the downward trend is most likely to continue. Therefore, if the level of 1.3482 is broken, the price will move further downwards.
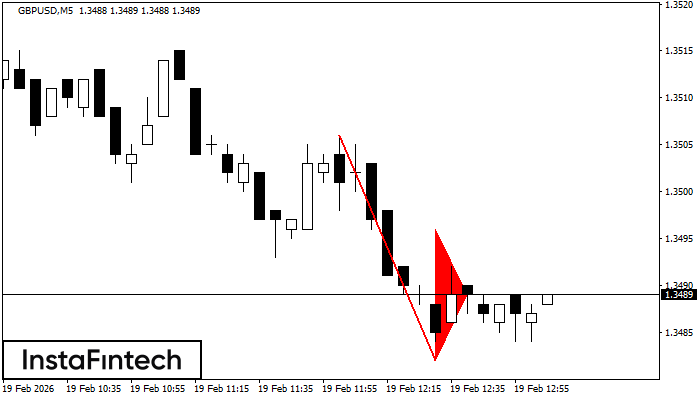
GBPUSD M5
Bearish pennant
The Bearish pennant pattern has formed on the GBPUSD M5 chart. It signals potential continuation of the existing trend. Specifications: the pattern’s bottom has the coordinate of 1.3482; the projection of the flagpole height is equal to 24 pips. In case the price breaks out the pattern’s bottom of 1.3482, the downtrend is expected to continue for further level 1.3467.