 中文
中文  Русский
 English
 Bahasa Indonesia
 Bahasa Malay
 ไทย
ไทย Español
 Deutsch
 Български
 Français
 Tiếng Việt
 বাংলা
বাংলা हिन्दी
 Čeština
 Українська
 Română
FX.co ★ Actual patterns. Technical analysis and trading recommendations

技术分析模式
There is nothing more precious to a trader than an ability to predict a further price movement. Technical analysis is a key to your successful transaction. At the same time, you can rely on common and recurring situations that arise in the same circumstances. Our Technical Analysis Patterns section features all trading recommendations based on the technical analysis patterns that help traders make projections and turn a profit.
Instrument:
所有
#Bitcoin
EURCHF
EURGBP
EURJPY
EURUSD
EURCAD
EURRUB
EURNZD
USDCAD
USDCHF
USDJPY
USDRUB
NZDCAD
NZDUSD
NZDCHF
NZDJPY
AUDCAD
AUDCHF
AUDJPY
AUDUSD
GBPUSD
GBPJPY
GBPAUD
GBPCHF
GOLD
SILVER
#AAPL
#AMZN
#EBAY
#FB
#GOOG
#MCD
#MA
#KO
#INTC
#MSFT
#NTDOY
#PEP
#TSLA
#TWTR
Figure:
所有
Triangle
Rectangle
Pennant
Flag
Head and Shoulders
Double Top
Triple top
Timeframe:
所有
M5
M15
M30
H1
D1
Signal strength:
所有
High
Medium
Low
Signal direction:
所有
Buy
Sell
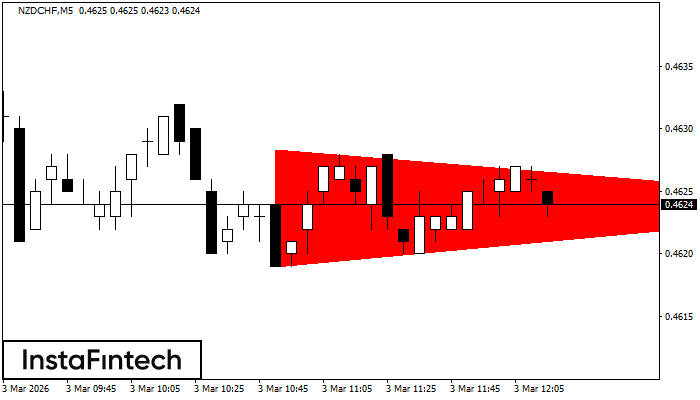
NZDCHF M5
Bearish Symmetrical Triangle
According to the chart of M5, NZDCHF formed the Bearish Symmetrical Triangle pattern. This pattern signals a further downward trend in case the lower border 0.4619 is breached. Here, a hypothetical profit will equal the width of the available pattern that is -9 pips.
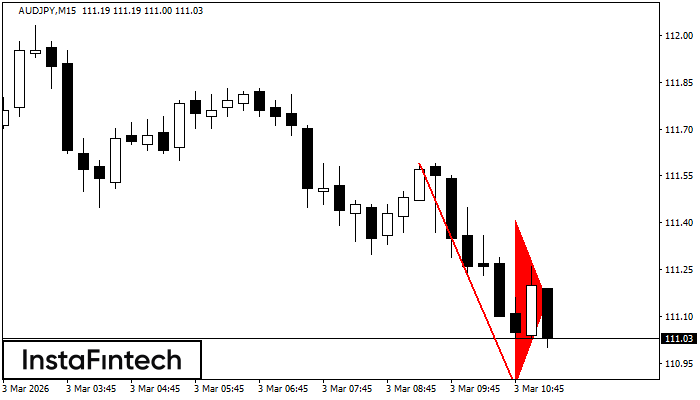
AUDJPY M15
Bearish pennant
The Bearish pennant pattern has formed on the AUDJPY M15 chart. This pattern type is characterized by a slight slowdown after which the price will move in the direction of the original trend. In case the price fixes below the pattern’s low of 110.88, a trader will be able to successfully enter the sell position.
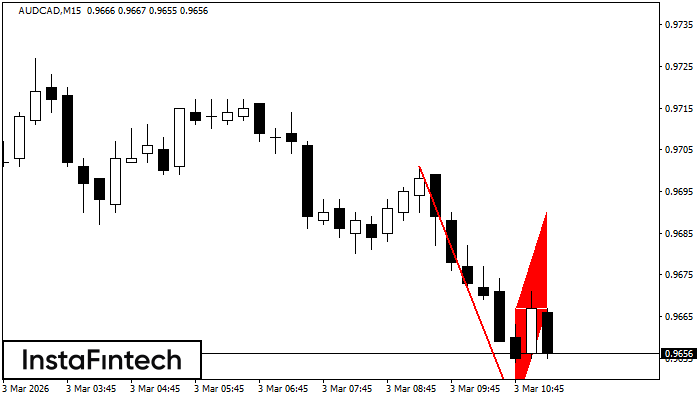
AUDCAD M15
Bearish Flag
The Bearish Flag pattern has been formed on AUDCAD at M15. The lower boundary of the pattern is located at 0.9643/0.9667 while the upper boundary lies at 0.9667/0.9691. The projection of the flagpole is 58 points. This formation signals that the downward trend is most likely to continue. Therefore, if the level of 0.9643 is broken, the price will move further downwards.
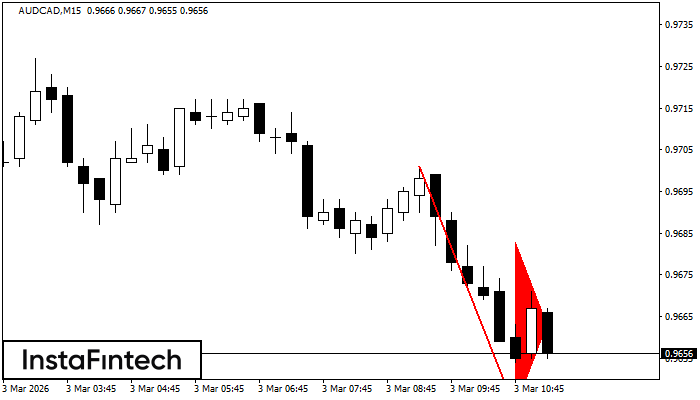
AUDCAD M15
Bearish pennant
The Bearish pennant pattern has formed on the AUDCAD M15 chart. This pattern type is characterized by a slight slowdown after which the price will move in the direction of the original trend. In case the price fixes below the pattern’s low of 0.9643, a trader will be able to successfully enter the sell position.
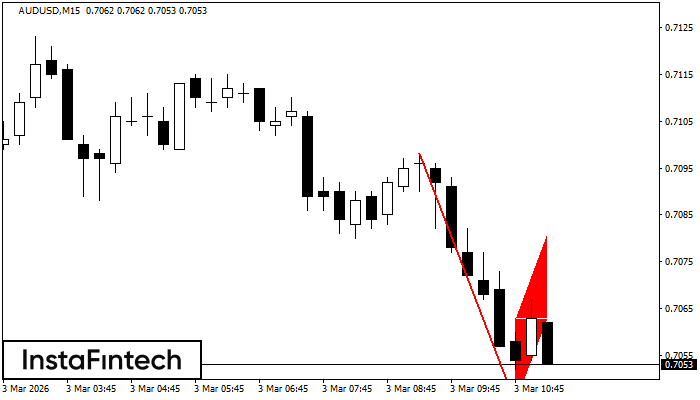
AUDUSD M15
Bearish Flag
The Bearish Flag pattern has been formed on AUDUSD at M15. The lower boundary of the pattern is located at 0.7045/0.7063 while the upper boundary lies at 0.7063/0.7081. The projection of the flagpole is 53 points. This formation signals that the downward trend is most likely to continue. Therefore, if the level of 0.7045 is broken, the price will move further downwards.
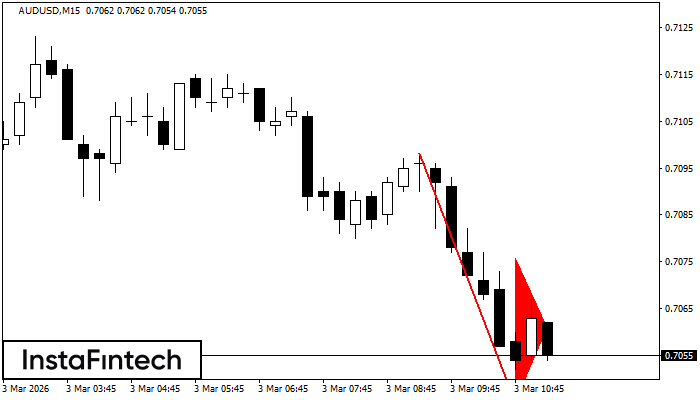
AUDUSD M15
Bearish pennant
The Bearish pennant pattern has formed on the AUDUSD M15 chart. This pattern type is characterized by a slight slowdown after which the price will move in the direction of the original trend. In case the price fixes below the pattern’s low of 0.7045, a trader will be able to successfully enter the sell position.
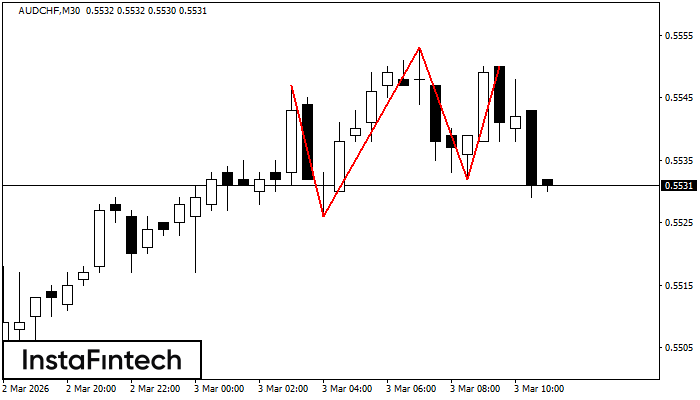
AUDCHF M30
Triple Top
The Triple Top pattern has formed on the chart of the AUDCHF M30. Features of the pattern: borders have an ascending angle; the lower line of the pattern has the coordinates 0.5526/0.5532 with the upper limit 0.5547/0.5550; the projection of the width is 21 points. The formation of the Triple Top figure most likely indicates a change in the trend from upward to downward. This means that in the event of a breakdown of the support level of 0.5526, the price is most likely to continue the downward movement.
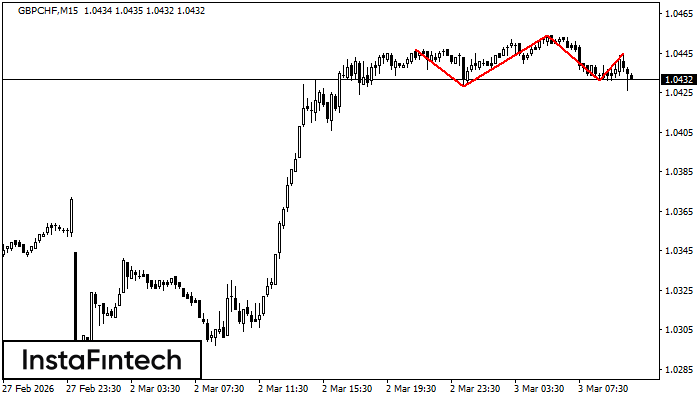
GBPCHF M15
Head and Shoulders
According to the chart of M15, GBPCHF formed the Head and Shoulders pattern. The Head’s top is set at 1.0454 while the median line of the Neck is found at 1.0428/1.0431. The formation of the Head and Shoulders pattern evidently signals a reversal of the upward trend. In other words, in case the scenario comes true, the price of GBPCHF will go towards 1.0409.
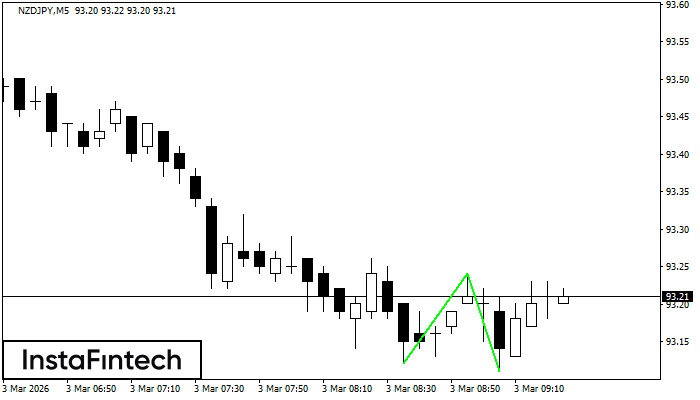
NZDJPY M5
Double Bottom
The Double Bottom pattern has been formed on NZDJPY M5. Characteristics: the support level 93.12; the resistance level 93.24; the width of the pattern 12 points. If the resistance level is broken, a change in the trend can be predicted with the first target point lying at the distance of 13 points.
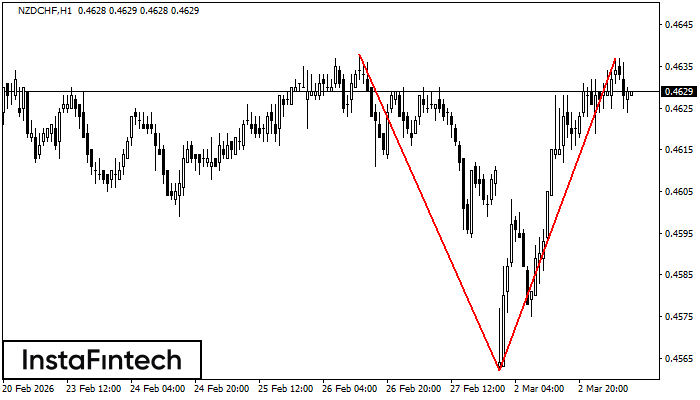
NZDCHF H1
Double Top
The Double Top pattern has been formed on NZDCHF H1. It signals that the trend has been changed from upwards to downwards. Probably, if the base of the pattern 0.4562 is broken, the downward movement will continue.