 English
  Русский
 Bahasa Indonesia
 Bahasa Malay
 ไทย
ไทย Español
 Deutsch
 Български
 Français
 Tiếng Việt
 中文
中文 বাংলা
বাংলা हिन्दी
 Čeština
 Українська
 Română

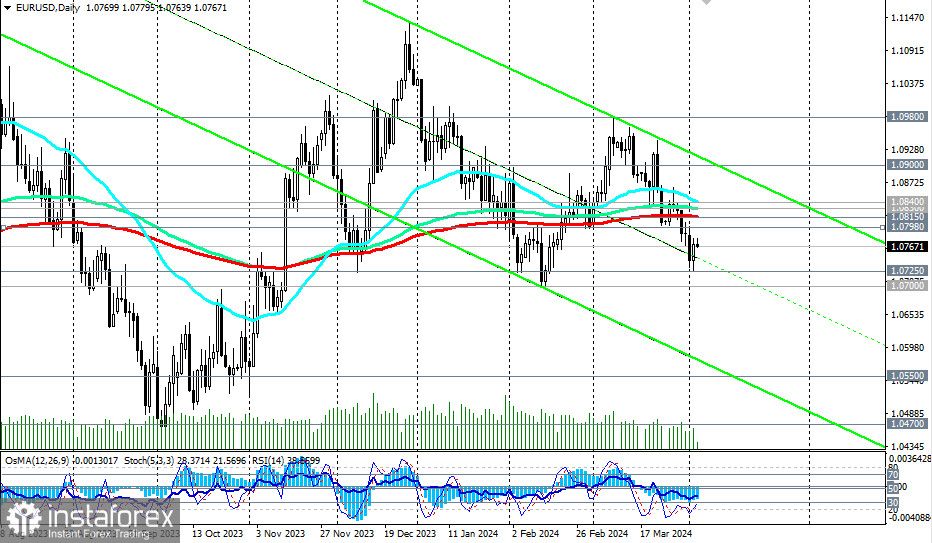
EUR/USD dropped into the zone of the medium-term bearish market after breaking through the zone of key support levels at 1.0840 (50 EMA on the daily chart), 1.0830 (144 EMA on the daily chart), and 1.0815 (200 EMA on the daily chart).
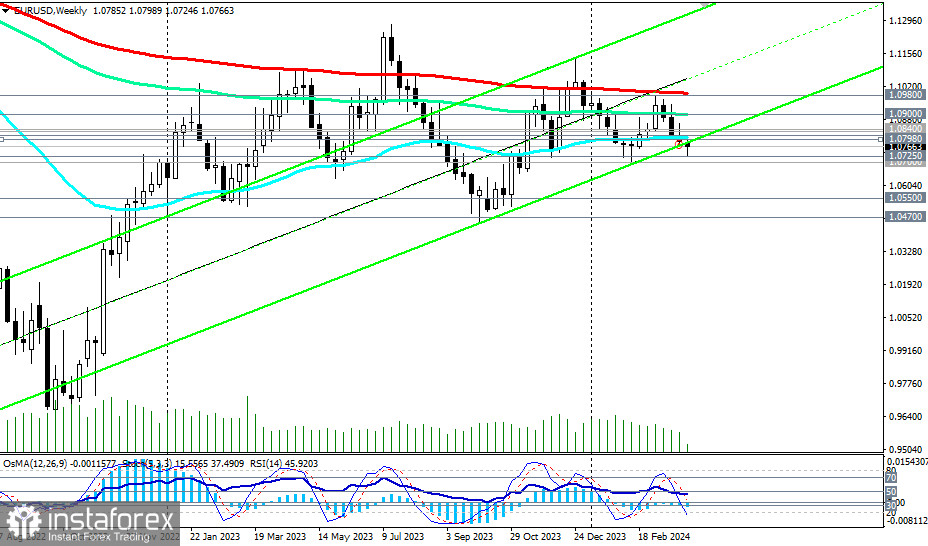
With the breakthrough of the important support levels at 1.0805 (50 EMA on the weekly chart) and 1.0775 (lower line of the upward channel on the weekly chart), the pair also "declared its intention" for further decline into the territory of the long-term bearish market, located below the key resistance levels at 1.0900 (144 EMA on the weekly chart), 1.0980 (200 EMA on the weekly chart).
At the same time, technical indicators RSI, OsMA, and Stochastic on the daily and weekly charts are on the sellers' side, also signaling the advantage of short positions.
Therefore, in the current situation, preference should be given to short positions on EUR/USD. However, a breakthrough of today's low at 1.0764 may become the very first signal for new positions.
The nearest downward targets are located at local support levels 1.0725 and 1.0700. Their breakthrough will open the way for EUR/USD to decline towards the lower boundary of the downward channel on the daily chart and levels 1.0550, 1.0500, and 1.0470.
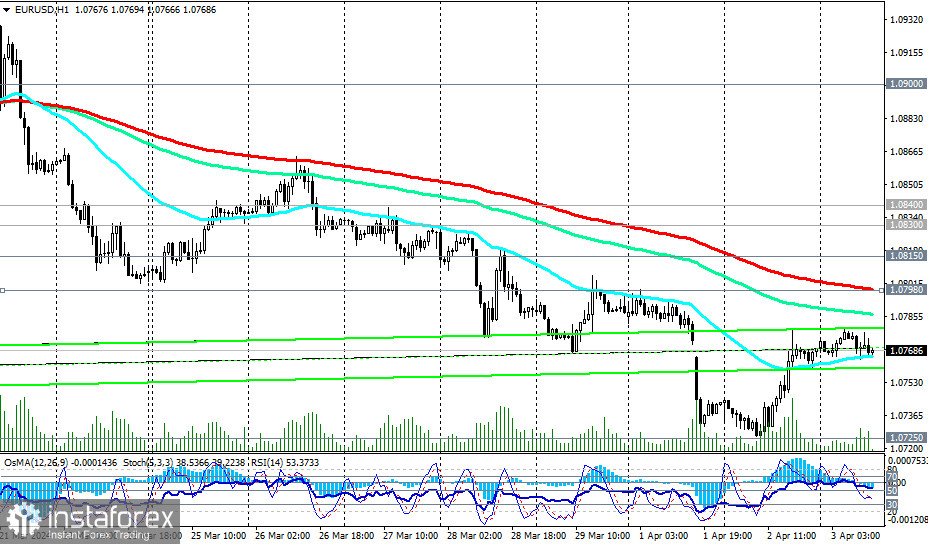
In an alternative scenario, the first signal for the resumption of long positions may be a breakthrough of the important short-term resistance level at 1.0798 (200 EMA on the 1-hour chart). Furthermore, a breakthrough of the zone of key resistance levels at 1.0815, 1.0830, and 1.0840 will bring EUR/USD into the territory of the medium-term bullish market, making long positions preferable again with targets near key resistance levels at 1.0900, 1.0980, 1.1000.
Trading Scenarios
Main Scenario: Sell Stop 1.0755. Stop-Loss 1.0805. Targets 1.0725, 1.0700, 1.0660, 1.0600, 1.0550, 1.0500, 1.0470, 1.0400, 1.0300
Alternative Scenario: Buy Stop 1.0845. Stop-Loss 1.0790. Targets 1.0900, 1.0920, 1.0980, 1.1000, 1.1040, 1.1090, 1.1100, 1.1140, 1.1200, 1.1275, 1.1300, 1.1400, 1.1500
"Targets" correspond to support/resistance levels. This also does not mean that they will necessarily be reached, but they can serve as a guideline for planning and placing trading positions.