 English
  Русский
 Bahasa Indonesia
 Bahasa Malay
 ไทย
ไทย Español
 Deutsch
 Български
 Français
 Tiếng Việt
 中文
中文 বাংলা
বাংলা हिन्दी
 Čeština
 Українська
 Română
FX.co ★ Actual patterns. Technical analysis and trading recommendations

Technical Analysis Patterns
There is nothing more precious to a trader than an ability to predict a further price movement. Technical analysis is a key to your successful transaction. At the same time, you can rely on common and recurring situations that arise in the same circumstances. Our Technical Analysis Patterns section features all trading recommendations based on the technical analysis patterns that help traders make projections and turn a profit.
Instrument:
All
#Bitcoin
EURCHF
EURGBP
EURJPY
EURUSD
EURCAD
EURRUB
EURNZD
USDCAD
USDCHF
USDJPY
USDRUB
NZDCAD
NZDUSD
NZDCHF
NZDJPY
AUDCAD
AUDCHF
AUDJPY
AUDUSD
GBPUSD
GBPJPY
GBPAUD
GBPCHF
GOLD
SILVER
#AAPL
#AMZN
#EBAY
#FB
#GOOG
#MCD
#MA
#KO
#INTC
#MSFT
#NTDOY
#PEP
#TSLA
#TWTR
Figure:
All
Triangle
Rectangle
Pennant
Flag
Head and Shoulders
Double Top
Triple top
Timeframe:
All
M5
M15
M30
H1
D1
Signal strength:
All
High
Medium
Low
Signal direction:
All
Buy
Sell
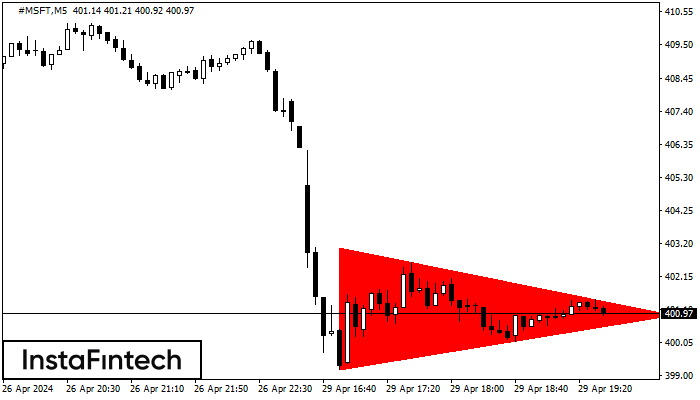
#MSFT M5
Bearish Symmetrical Triangle
According to the chart of M5, #MSFT formed the Bearish Symmetrical Triangle pattern. Description: The lower border is 399.20/400.91 and upper border is 403.08/400.91. The pattern width is measured on the chart at -388 pips. The formation of the Bearish Symmetrical Triangle pattern evidently signals a continuation of the downward trend. In other words, if the scenario comes true and #MSFT breaches the lower border, the price could continue its move toward 400.76.
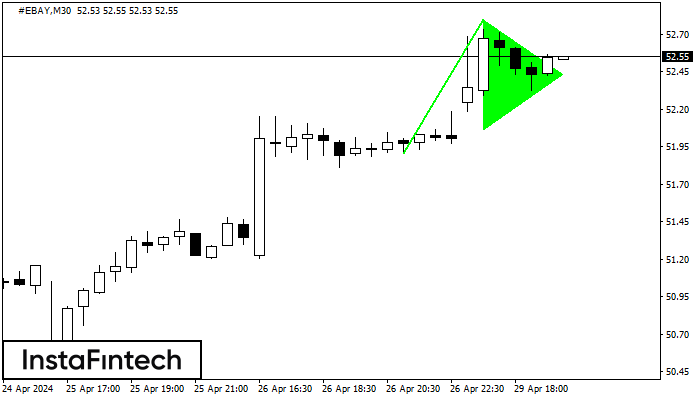
#EBAY M30
Bullish pennant
The Bullish pennant signal – Trading instrument #EBAY M30, continuation pattern. Forecast: it is possible to set up a buy position above the pattern’s high of 52.80, with the prospect of the next move being a projection of the flagpole height.
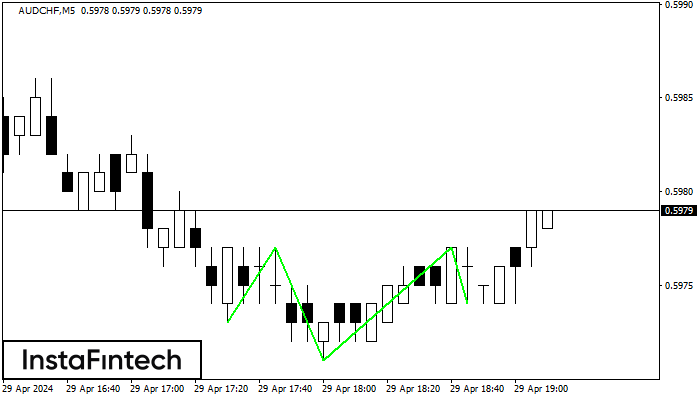
AUDCHF M5
Inverse Head and Shoulder
According to the chart of M5, AUDCHF formed the Inverse Head and Shoulder pattern. The Head’s top is set at 0.5977 while the median line of the Neck is found at 0.5971/0.5974. The formation of the Inverse Head and Shoulder pattern evidently signals a reversal of the downward trend. In other words, in case the scenario comes true, the price of AUDCHF will go towards 0.5992
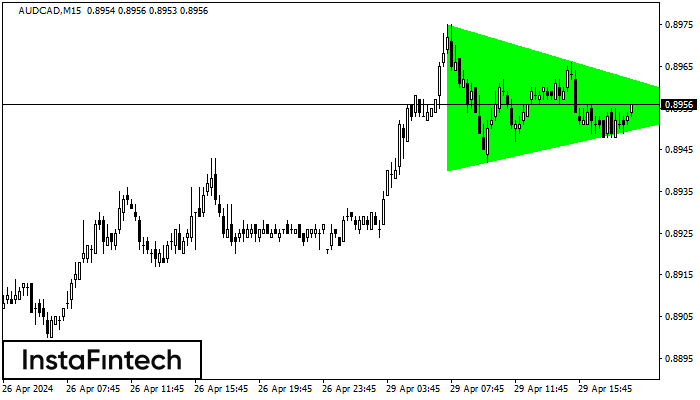
AUDCAD M15
Bullish Symmetrical Triangle
According to the chart of M15, AUDCAD formed the Bullish Symmetrical Triangle pattern. Description: This is the pattern of a trend continuation. 0.8975 and 0.8940 are the coordinates of the upper and lower borders respectively. The pattern width is measured on the chart at 35 pips. Outlook: If the upper border 0.8975 is broken, the price is likely to continue its move by 0.8978.
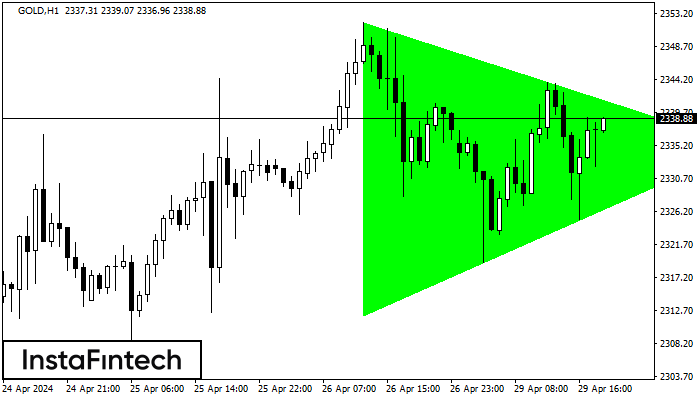
GOLD H1
Bullish Symmetrical Triangle
According to the chart of H1, GOLD formed the Bullish Symmetrical Triangle pattern, which signals the trend will continue. Description. The upper border of the pattern touches the coordinates 2352.03/2335.15 whereas the lower border goes across 2312.06/2335.15. The pattern width is measured on the chart at 3997 pips. If the Bullish Symmetrical Triangle pattern is in progress during the upward trend, this indicates the current trend will go on. In case 2335.15 is broken, the price could continue its move toward 2335.55.
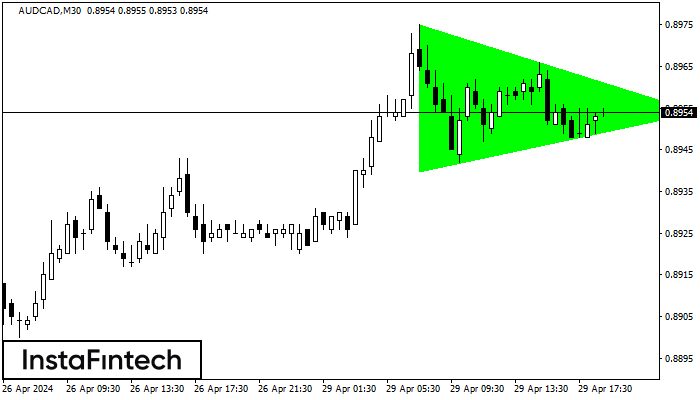
AUDCAD M30
Bullish Symmetrical Triangle
According to the chart of M30, AUDCAD formed the Bullish Symmetrical Triangle pattern. Description: This is the pattern of a trend continuation. 0.8975 and 0.8940 are the coordinates of the upper and lower borders respectively. The pattern width is measured on the chart at 35 pips. Outlook: If the upper border 0.8975 is broken, the price is likely to continue its move by 0.8984.
NZDUSD M30
Bullish Rectangle
According to the chart of M30, NZDUSD formed the Bullish Rectangle. This type of a pattern indicates a trend continuation. It consists of two levels: resistance 0.5978 and support 0.5952. In case the resistance level 0.5978 - 0.5978 is broken, the instrument is likely to follow the bullish trend.
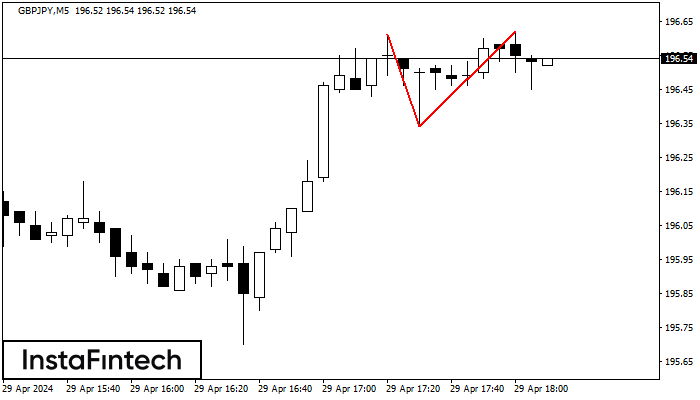
GBPJPY M5
Double Top
On the chart of GBPJPY M5 the Double Top reversal pattern has been formed. Characteristics: the upper boundary 196.62; the lower boundary 196.34; the width of the pattern 28 points. The signal: a break of the lower boundary will cause continuation of the downward trend targeting the 196.19 level.
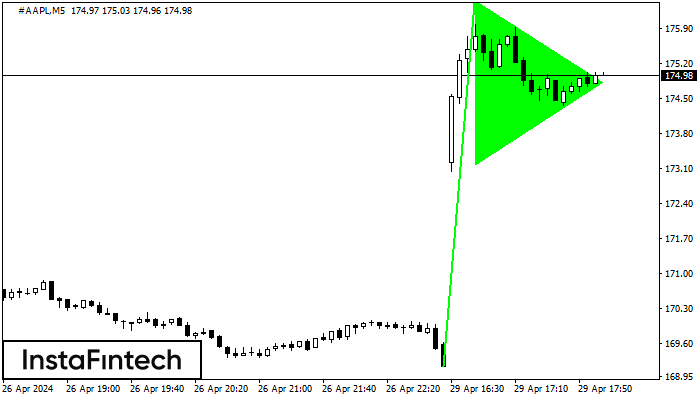
#AAPL M5
Bullish pennant
The Bullish pennant pattern is formed on the #AAPL M5 chart. It is a type of the continuation pattern. Supposedly, in case the price is fixed above the pennant’s high of 176.47, a further uptrend is possible.
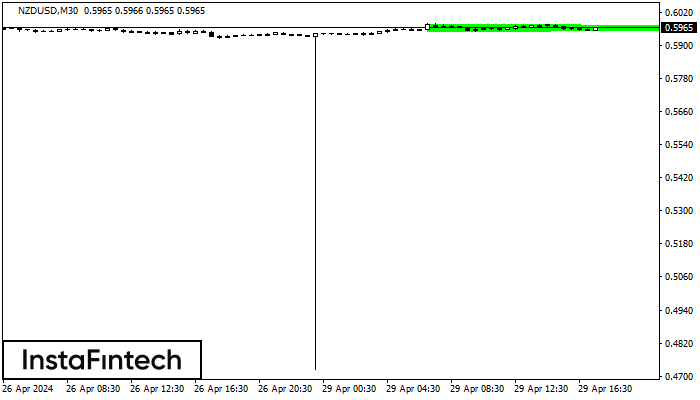
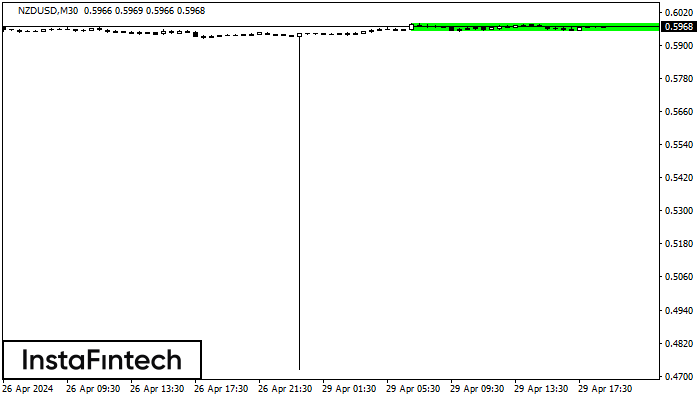
NZDUSD M30
Bullish Symmetrical Triangle
According to the chart of M30, NZDUSD formed the Bullish Symmetrical Triangle pattern, which signals the trend will continue. Description. The upper border of the pattern touches the coordinates 0.5978/0.5963 whereas the lower border goes across 0.5951/0.5963. The pattern width is measured on the chart at 27 pips. If the Bullish Symmetrical Triangle pattern is in progress during the upward trend, this indicates the current trend will go on. In case 0.5963 is broken, the price could continue its move toward 0.5993.