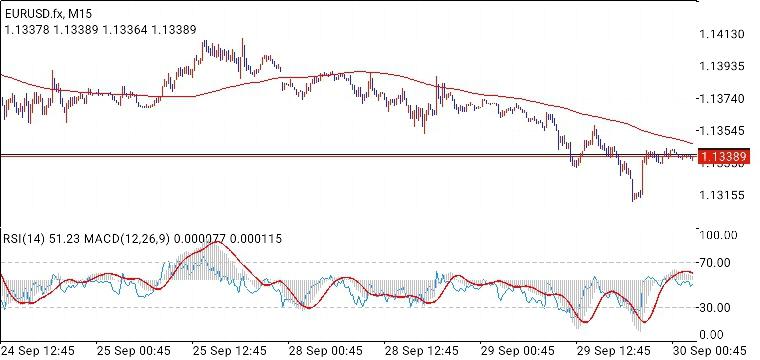
 EURUSD M15 Technical Outlook
 Snapshot: EURUSD is trading at 1.13389 (30 Sep, early session), roughly flat on the latest bar (O 1.13378, H 1.13389, L 1.13364).
Market Structure The pair peaked near 1.1415 on 25 Sep and has since moved lower in a series of lower highs and lower lows. The rally that started around 24 Sep ran out of steam at 1.1410-1.1415, followed by a rejection and a grind down through 28 Sep. The sharpest leg came on 29 Sep, when price dropped to a low near 1.1313 before a sharp V-shaped rebound of roughly 25 pips. That bounce shows dip buyers defending the 1.1310-1.1315 area.
Trend and Moving Average The long red moving average is sloping down and sits above price at roughly 1.1350-1.1355. Price has been below it since the 29 Sep breakdown, which keeps the short-term bias bearish. The current price is consolidating just under the average, so watch how it reacts on a retest.
Momentum RSI(14) at 51.23: neutral. It has recovered from oversold territory near 30 during the 29 Sep selloff, which confirms the bounce but shows no strong directional conviction. MACD(12,26,9), 0.000077 / 0.000115: the readings are small and near the zero line, indicating fading momentum on both sides. The histogram has flattened after the deep negative phase, which suggests selling pressure has eased but buyers haven't taken control.
Key Levels Resistance: 1.1350-1.1355 (moving average zone), then 1.1375-1.1390 (the 29 Sep breakdown area), then 1.1415 (swing high). Support: 1.1330 (current consolidation floor), then 1.1313-1.1315 (recent swing low). A break below the latter would open the way toward 1.1290.
Scenarios Bearish (primary): Price fails to close above the moving average, and the MACD rolls back under its signal line while RSI slips below 45. A break under 1.1330 would target a retest of 1.1315, with continuation below that. Bullish (alternative): A sustained M15 close above 1.1355 that flips the moving average to support, with RSI pushing above 55-60 and MACD crossing higher. That would target 1.1375-1.1390 first, where the prior breakdown supply sits.
Trading Considerations The tight, low-volatility range between 1.1330 and 1.1350 favors waiting for a breakout with a clear candle close rather than trading inside the range. Short setups near the moving average with stops above 1.1360 offer a better risk-reward than chasing the low. Long setups need confirmation above the average, since buying below it is counter-trend. Since this is M15, signals are short-lived. Check the H1 and H4 trend for context, and be aware of upcoming economic releases that can invalidate the setup quickly. This is a technical read of the chart only, not financial advice.
*Публикуваният тук анализ на пазара има за цел да повиши вашата информираност, но не и да даде указания за извършване на сделка
 Български
 Русский
 English
 Bahasa Indonesia
 Bahasa Malay
 ไทย
ไทย Español
 Deutsch
 Français
 Tiếng Việt
 中文
中文 বাংলা
বাংলা हिन्दी
 Čeština
 Українська
 Română
