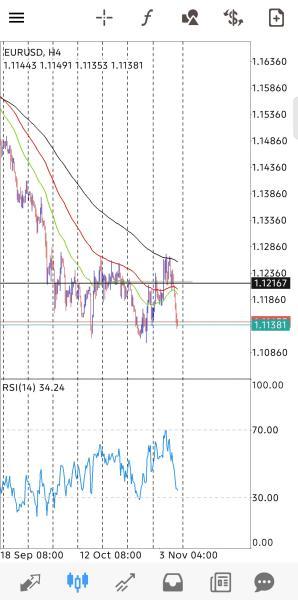
EURUSD on the four-hour timeframe is currently at the level 1.11381 after experiencing a fairly sharp decline from the resistance area at level 1.12167. This movement indicates that selling pressure once again dominates the market after the upward attempt failed to hold above the resistance area and the Moving Average lines. This decline occurred quite rapidly and was accompanied by a large red candle, which indicates that sellers have significant power in moving the price. As long as the price remains below the level 1.12167, the overall market structure still tends toward a decline and any rallies that occur can still be considered temporary corrections within a larger downtrend. From the moving averages side, the Moving Average condition shows a clear downward direction with a configuration that still points to a decline. The short-term moving average line is below the medium-term and long-term moving average lines, which confirms that the downtrend is still valid and has not shown signs of a reversal. The price having moved below all of those moving average lines provides additional confirmation that the downward momentum remains strong. Furthermore, the rejection that occurred at the moving average lines when the price tried to rise towards the 1.12600 area indicates that those lines function well as dynamic resistance. As long as the price remains below this moving average arrangement, the tendency to decline has a greater chance of continuing compared to the likelihood of a reversal. The Relative Strength Index indicator on the 14 period is currently at level 34.24 and shows a very sharp decline from the area near 70. This rapid decline in the RSI depicts that the downward momentum is strengthening and selling pressure has begun to increase significantly in a relatively short time. Although the RSI has approached the oversold area at level 30, this position cannot yet be used as a reversal signal as long as the price remains in a strong downtrend. In clear trend conditions, the RSI can remain in low areas for a fairly long period. Therefore, this RSI decline is better read as confirmation of strengthening downward momentum, not as an indication that the price will soon reverse upward. Based on these conditions, the most ideal strategy is to wait for selling opportunities in the upper resistance area, namely around 1.12167 up to the moving average area above it, while waiting for clear confirmation. In addition, it is important to wait for confirmation of a support breakout first before making more aggressive decisions. The support area around 1.11353 to 1.11000 becomes a key level to watch. If the price manages to break that support with a clear candle close below it, then the price has the potential to continue declining toward the next lower support level. Conversely, if the price fails to break the support and shows rejection, then there is a possibility of a correction upward toward the resistance area. Therefore, risk management should be observed by placing a stop loss above the resistance area so that the risk-to-reward ratio remains well maintained.
*Публикуваният тук анализ на пазара има за цел да повиши вашата информираност, но не и да даде указания за извършване на сделка
 Български

 Русский
 English
 Bahasa Indonesia
 Bahasa Malay
 ไทย
 Español
 Deutsch
 Français
 Tiếng Việt
 中文
 বাংলা
 हिन्दी
 Čeština
 Українська
 Română

