 Français
  Русский
 English
 Bahasa Indonesia
 Bahasa Malay
 ไทย
ไทย Español
 Deutsch
 Български
 Tiếng Việt
 中文
中文 বাংলা
বাংলা हिन्दी
 Čeština
 Українська
 Română
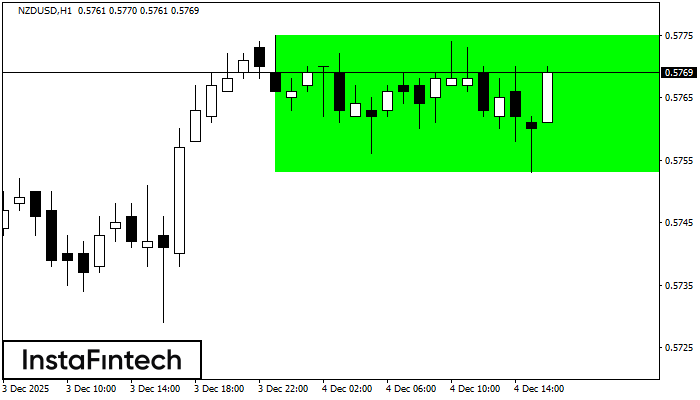 According to the chart of H1, NZDUSD formed the Bullish Rectangle. This type of a pattern indicates a trend continuation. It consists of two levels: resistance 0.5775 and support 0.5753. In case the resistance level 0.5775 - 0.5775 is broken, the instrument is likely to follow the bullish trend.
 FX.co ★ NZDUSD H1: Bullish Rectangle
Signal strength 4 of 5
NZDUSD H1: Bullish Rectangle
According to the chart of H1, NZDUSD formed the Bullish Rectangle. This type of a pattern indicates a trend continuation. It consists of two levels: resistance 0.5775 and support 0.5753. In case the resistance level 0.5775 - 0.5775 is broken, the instrument is likely to follow the bullish trend. *L'analyse de marché présentée est de nature informative et n'est pas une incitation à effectuer une transaction