 Français
  Русский
 English
 Bahasa Indonesia
 Bahasa Malay
 ไทย
ไทย Español
 Deutsch
 Български
 Tiếng Việt
 中文
中文 বাংলা
বাংলা हिन्दी
 Čeština
 Українська
 Română
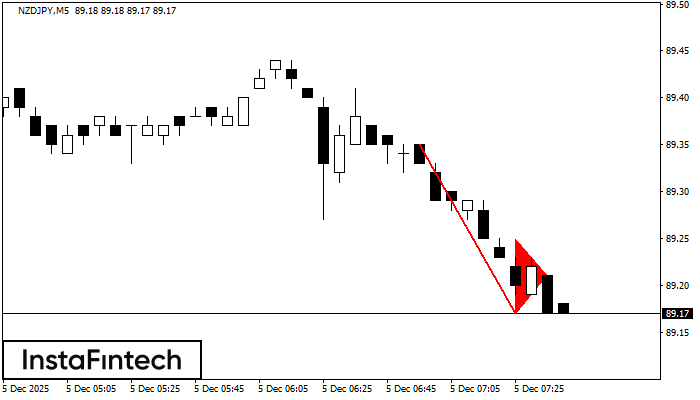 The Bearish pennant pattern has formed on the NZDJPY M5 chart. It signals potential continuation of the existing trend. Specifications: the pattern’s bottom has the coordinate of 89.17; the projection of the flagpole height is equal to 18 pips. In case the price breaks out the pattern’s bottom of 89.17, the downtrend is expected to continue for further level 89.02.
 The M5 and M15 time frames may have more false entry points.