 Français
  Русский
 English
 Bahasa Indonesia
 Bahasa Malay
 ไทย
ไทย Español
 Deutsch
 Български
 Tiếng Việt
 中文
中文 বাংলা
বাংলা हिन्दी
 Čeština
 Українська
 Română
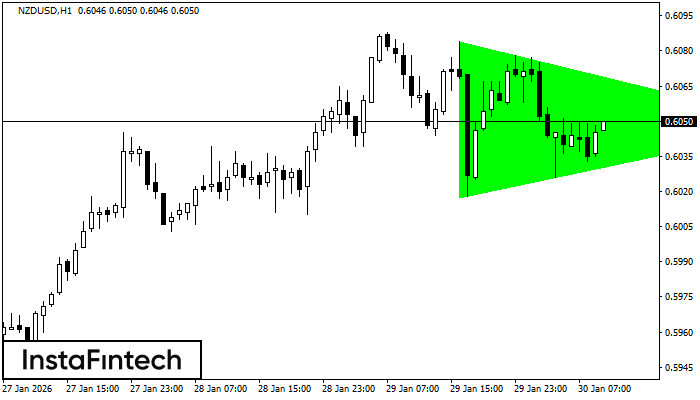 According to the chart of H1, NZDUSD formed the Bullish Symmetrical Triangle pattern. Description: This is the pattern of a trend continuation. 0.6084 and 0.6017 are the coordinates of the upper and lower borders respectively. The pattern width is measured on the chart at 67 pips. Outlook: If the upper border 0.6084 is broken, the price is likely to continue its move by 0.6088.
 FX.co ★ NZDUSD H1: Bullish Symmetrical Triangle
Signal strength 4 of 5
NZDUSD H1: Bullish Symmetrical Triangle
According to the chart of H1, NZDUSD formed the Bullish Symmetrical Triangle pattern. Description: This is the pattern of a trend continuation. 0.6084 and 0.6017 are the coordinates of the upper and lower borders respectively. The pattern width is measured on the chart at 67 pips. Outlook: If the upper border 0.6084 is broken, the price is likely to continue its move by 0.6088. *L'analyse de marché présentée est de nature informative et n'est pas une incitation à effectuer une transaction