 Français
  Русский
 English
 Bahasa Indonesia
 Bahasa Malay
 ไทย
ไทย Español
 Deutsch
 Български
 Tiếng Việt
 中文
中文 বাংলা
বাংলা हिन्दी
 Čeština
 Українська
 Română
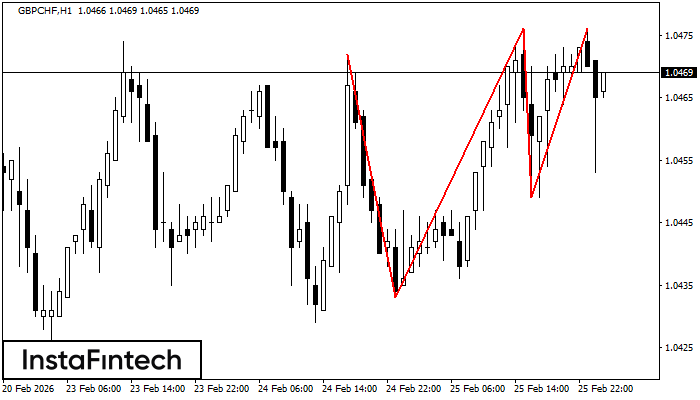 The Triple Top pattern has formed on the chart of the GBPCHF H1. Features of the pattern: borders have an ascending angle; the lower line of the pattern has the coordinates 1.0433/1.0449 with the upper limit 1.0472/1.0476; the projection of the width is 39 points. The formation of the Triple Top figure most likely indicates a change in the trend from upward to downward. This means that in the event of a breakdown of the support level of 1.0433, the price is most likely to continue the downward movement.
 FX.co ★ GBPCHF H1: Triple Top
Signal strength 4 of 5
GBPCHF H1: Triple Top
The Triple Top pattern has formed on the chart of the GBPCHF H1. Features of the pattern: borders have an ascending angle; the lower line of the pattern has the coordinates 1.0433/1.0449 with the upper limit 1.0472/1.0476; the projection of the width is 39 points. The formation of the Triple Top figure most likely indicates a change in the trend from upward to downward. This means that in the event of a breakdown of the support level of 1.0433, the price is most likely to continue the downward movement. *L'analyse de marché présentée est de nature informative et n'est pas une incitation à effectuer une transaction