 Français
 Русский
 English
 Bahasa Indonesia
 Bahasa Malay
 ไทย
ไทย Español
 Deutsch
 Български
 Tiếng Việt
 中文
中文 বাংলা
বাংলা हिन्दी
 Čeština
 Українська
 Română

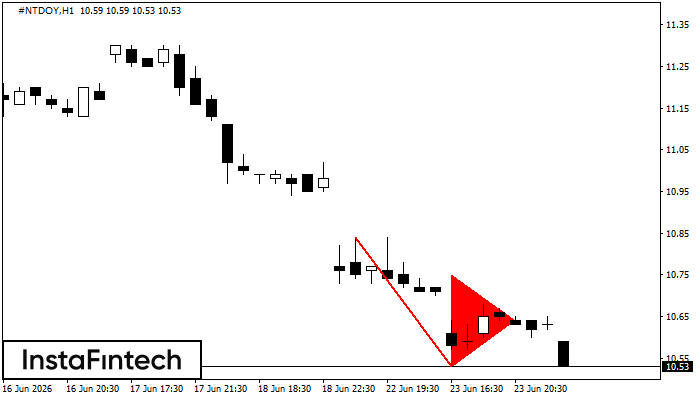 The Bearish pennant pattern has formed on the #NTDOY H1 chart. It signals potential continuation of the existing trend. Specifications: the pattern’s bottom has the coordinate of 10.53; the projection of the flagpole height is equal to 31 pips. In case the price breaks out the pattern’s bottom of 10.53, the downtrend is expected to continue for further level 10.13.
 FX.co ★ #NTDOY H1: Bearish pennant
Signal strength 4 of 5
#NTDOY H1: Bearish pennant
The Bearish pennant pattern has formed on the #NTDOY H1 chart. It signals potential continuation of the existing trend. Specifications: the pattern’s bottom has the coordinate of 10.53; the projection of the flagpole height is equal to 31 pips. In case the price breaks out the pattern’s bottom of 10.53, the downtrend is expected to continue for further level 10.13. *L'analyse de marché présentée est de nature informative et n'est pas une incitation à effectuer une transaction