 Français
 Русский
 English
 Bahasa Indonesia
 Bahasa Malay
 ไทย
ไทย Español
 Deutsch
 Български
 Tiếng Việt
 中文
中文 বাংলা
বাংলা हिन्दी
 Čeština
 Українська
 Română

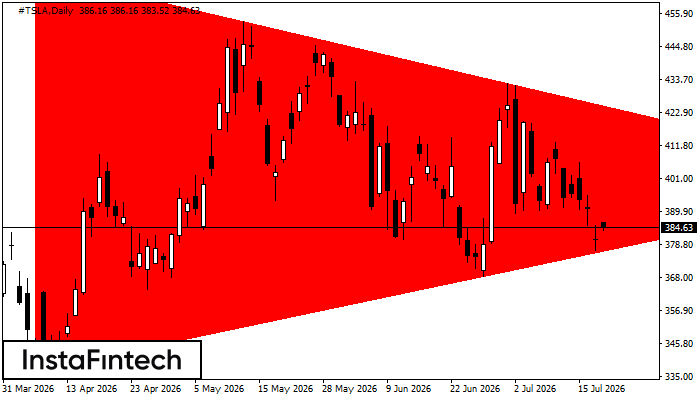 According to the chart of D1, #TSLA formed the Bearish Symmetrical Triangle pattern. This pattern signals a further downward trend in case the lower border 337.01 is breached. Here, a hypothetical profit will equal the width of the available pattern that is -13232 pips.
 FX.co ★ #TSLA D1: Bearish Symmetrical Triangle
Signal strength 5 of 5
#TSLA D1: Bearish Symmetrical Triangle
According to the chart of D1, #TSLA formed the Bearish Symmetrical Triangle pattern. This pattern signals a further downward trend in case the lower border 337.01 is breached. Here, a hypothetical profit will equal the width of the available pattern that is -13232 pips. *L'analyse de marché présentée est de nature informative et n'est pas une incitation à effectuer une transaction