 Français
 Русский
 English
 Bahasa Indonesia
 Bahasa Malay
 ไทย
ไทย Español
 Deutsch
 Български
 Tiếng Việt
 中文
中文 বাংলা
বাংলা हिन्दी
 Čeština
 Українська
 Română
FX.co ★ Modèles réels. Analyse technique et recommandations de trading

Modèles d'analyse technique
There is nothing more precious to a trader than an ability to predict a further price movement. Technical analysis is a key to your successful transaction. At the same time, you can rely on common and recurring situations that arise in the same circumstances. Our Technical Analysis Patterns section features all trading recommendations based on the technical analysis patterns that help traders make projections and turn a profit.
Outil:
1 sélectionné
#Bitcoin
EURCHF
EURGBP
EURJPY
EURUSD
EURCAD
EURRUB
EURNZD
USDCAD
USDCHF
USDJPY
USDRUB
NZDCAD
NZDUSD
NZDCHF
NZDJPY
AUDCAD
AUDCHF
AUDJPY
AUDUSD
GBPUSD
GBPJPY
GBPAUD
GBPCHF
GOLD
SILVER
#AAPL
#AMZN
#EBAY
#FB
#GOOG
#MCD
#MA
#KO
#INTC
#MSFT
#NTDOY
#PEP
#TSLA
#TWTR
Figure:
All
Triangle
Rectangle
Fanion
Drapeau
Épaule-tête-épaule
Double sommet
Triple sommet
Timeframe:
All
M5
M15
M30
H1
D1
Signal strength:
All
High
Medium
Low
Signal direction:
All
Buy
Sell
EURCAD
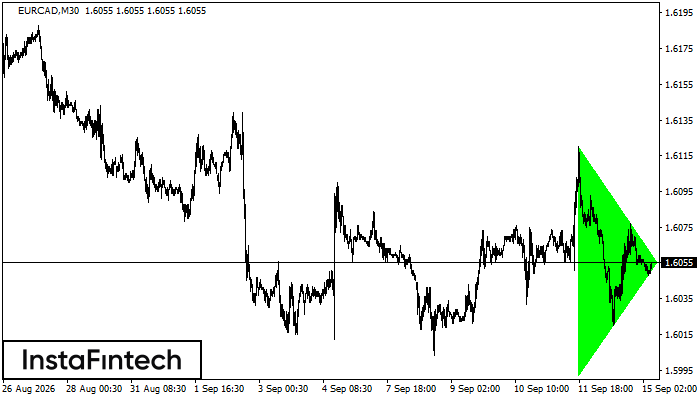
EURCAD M30
Triangle symétrique haussier
Sur le graphique M30, EURCAD a formé la figure « Triangle symétrique haussier », qui signale une poursuite de tendance. La limite supérieure passe par 1.6120/1.6055 et la limite inférieure par 1.5992/1.6055. La largeur de la figure est de 128 points. Dans une tendance haussière, la formation de « Triangle symétrique haussier » suggère la poursuite du mouvement. En cas de franchissement de 1.6055, le cours pourrait évoluer vers 1.6085.
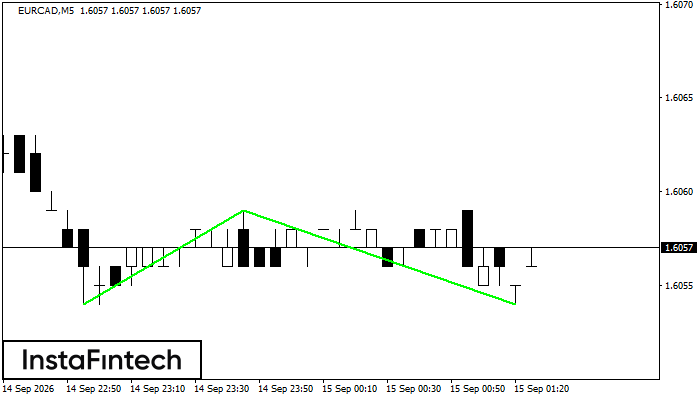
EURCAD M5
Double creux
La figure « Double creux » s’est formée sur EURCAD M5. Le support se situe à 1.6054, la résistance à 1.6059 et la largeur de la figure est de 5 points. Le franchissement de la résistance pourrait signaler un retournement, avec un premier objectif à une distance de 5 points.
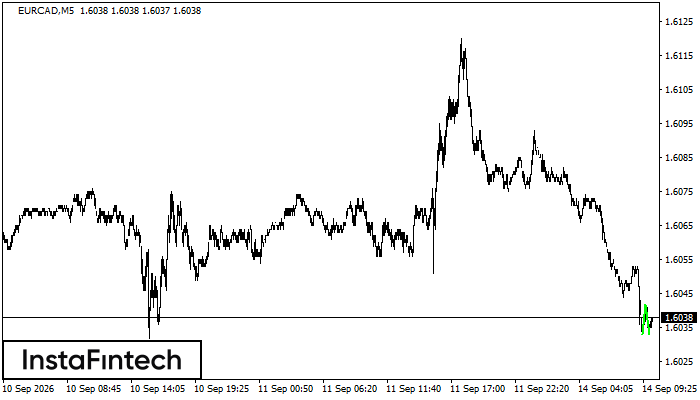
EURCAD M5
Double creux
La figure « Double creux » s’est formée sur EURCAD M5 et signale un retournement de la tendance baissière vers une tendance haussière. Une position longue peut être envisagée après le franchissement de la limite supérieure 1.6042. La largeur actuelle de la figure, soit 9 points, sert à projeter l’amplitude du prochain mouvement.
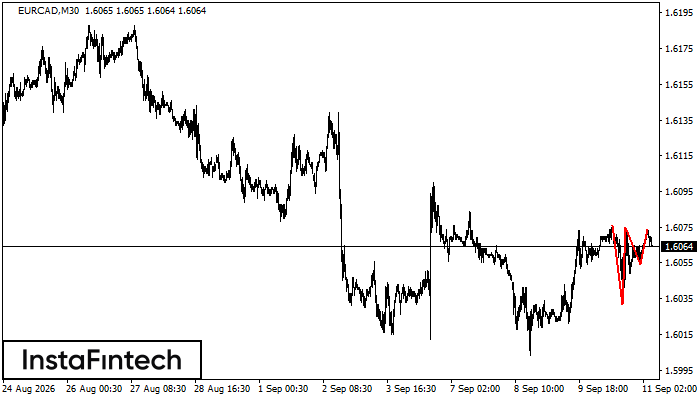
EURCAD M30
Triple sommet
La figure de retournement « Triple sommet » s’est formée sur le graphique EURCAD M30. La limite supérieure passe par 1.6076/1.6074, la limite inférieure par 1.6032/1.6054 et la largeur actuelle est de 21 points. Si le support de confirmation à 1.6032 est franchi, cette largeur peut servir à projeter le mouvement baissier.
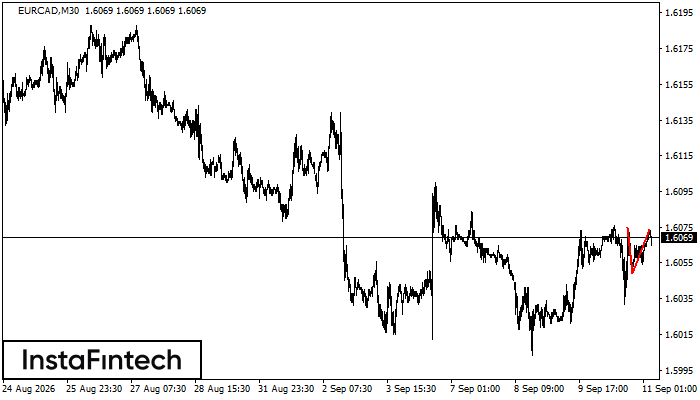
EURCAD M30
Double sommet
La figure « Double sommet » s’est formée sur EURCAD M30 et signale un passage possible d’une tendance haussière à une tendance baissière. Si la base à 1.6049 est franchie, le mouvement baissier devrait se poursuivre.
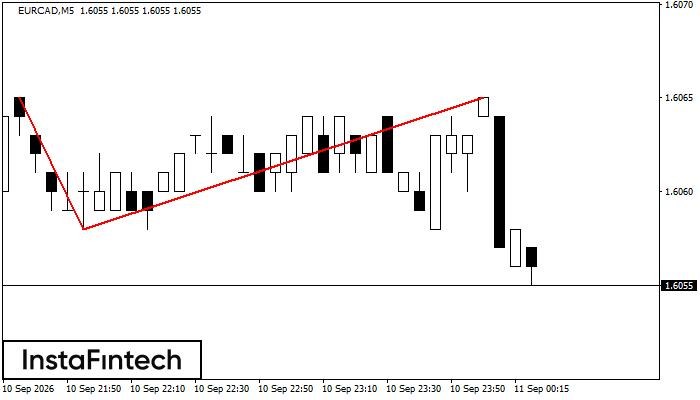
EURCAD M5
Double sommet
La figure de retournement « Double sommet » s’est formée sur EURCAD M5. La limite supérieure se situe à 1.6065, la limite inférieure à 1.6058 et la largeur est de 7 points. Une position courte peut être envisagée sous 1.6058, avec un objectif possible à 1.6043.
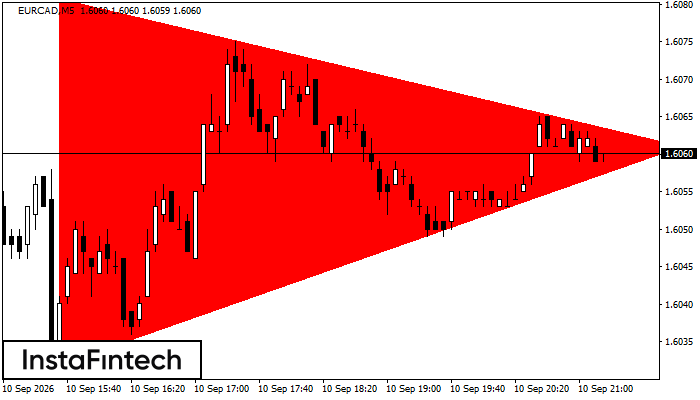
EURCAD M5
Triangle symétrique baissier
Sur le graphique M5, EURCAD a formé la figure « Triangle symétrique baissier ». Recommandation : le franchissement de la limite inférieure à 1.6032 pourrait entraîner la poursuite de la tendance baissière.
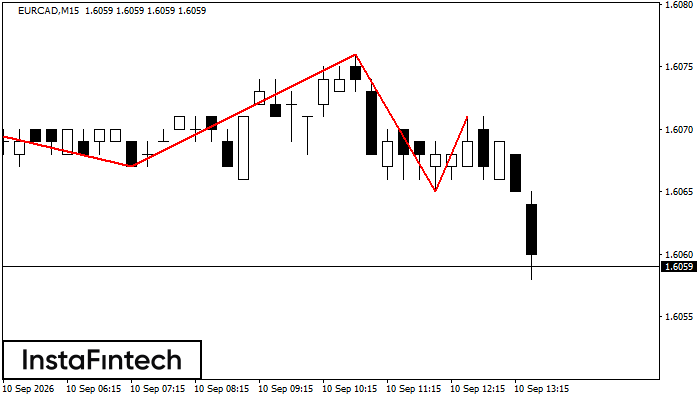
EURCAD M15
Épaule-tête-épaule
Sur le graphique M15, EURCAD a formé la figure « Épaule-tête-épaule ». Le sommet de la tête se situe à 1.6076 et la ligne de cou passe par 1.6067/1.6065. La formation de « Épaule-tête-épaule » signale un possible retournement de la tendance haussière. Une cassure sous le plus bas des deux points de la ligne de cou pourrait confirmer le retournement baissier.
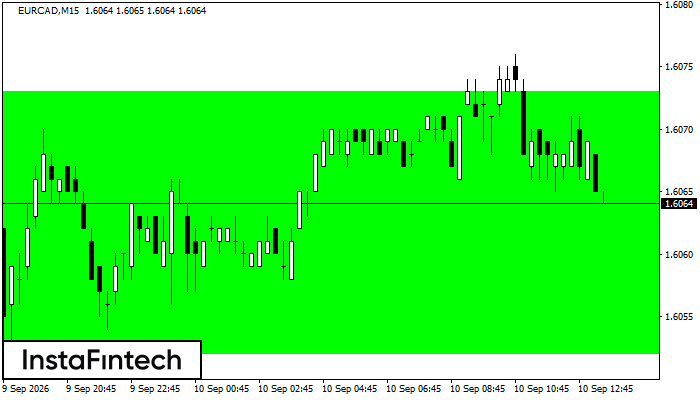
EURCAD M15
Rectangle haussier
Sur le graphique M15, EURCAD a formé la figure « Rectangle haussier », qui indique une poursuite de tendance. La limite supérieure se situe à 1.6073 et la limite inférieure à 1.6052. Le signal invite à envisager une position longue au-dessus de la limite supérieure 1.6073 de « Rectangle haussier ».
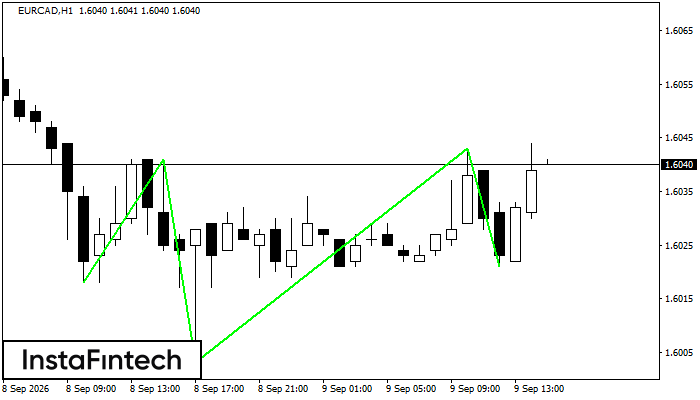
EURCAD H1
Épaule-tête-épaule inversée
Sur le graphique H1, EURCAD a formé la figure technique « Épaule-tête-épaule inversée ». Une cassure au-dessus du plus haut des deux points de la ligne de cou 1.6041/1.6043 pourrait confirmer le retournement haussier.