In yesterday's trading session, considering the dollar's growth prospects, the evening statistics coinciding with the forecasts of the core PCE inflation in the US and the subsequently released Michigan Index did not give the EURUSD pair a technical breakout of the ascending channel. Otherwise, I believe they would have broken through. Nevertheless, the scenario of a breakout signal to complete the correction of the ascending trend remains valid. Good day, colleagues! Regarding the currency pair Euro/US Dollar, Friday ended with a decline, refreshing Thursday's low. An inside bar was formed on the daily timeframe because Friday also closed above Thursday's high. Additionally, a trendline support was broken and the price closed below it. Therefore, the end of the week showed a shift in sentiment, indicating that bears might wake up and continue to push the euro down next week. To do this, they will need to establish themselves below the trendline and continue to update lows, gathering liquidity along the way, with 1.0755 potentially becoming a local high for some time.
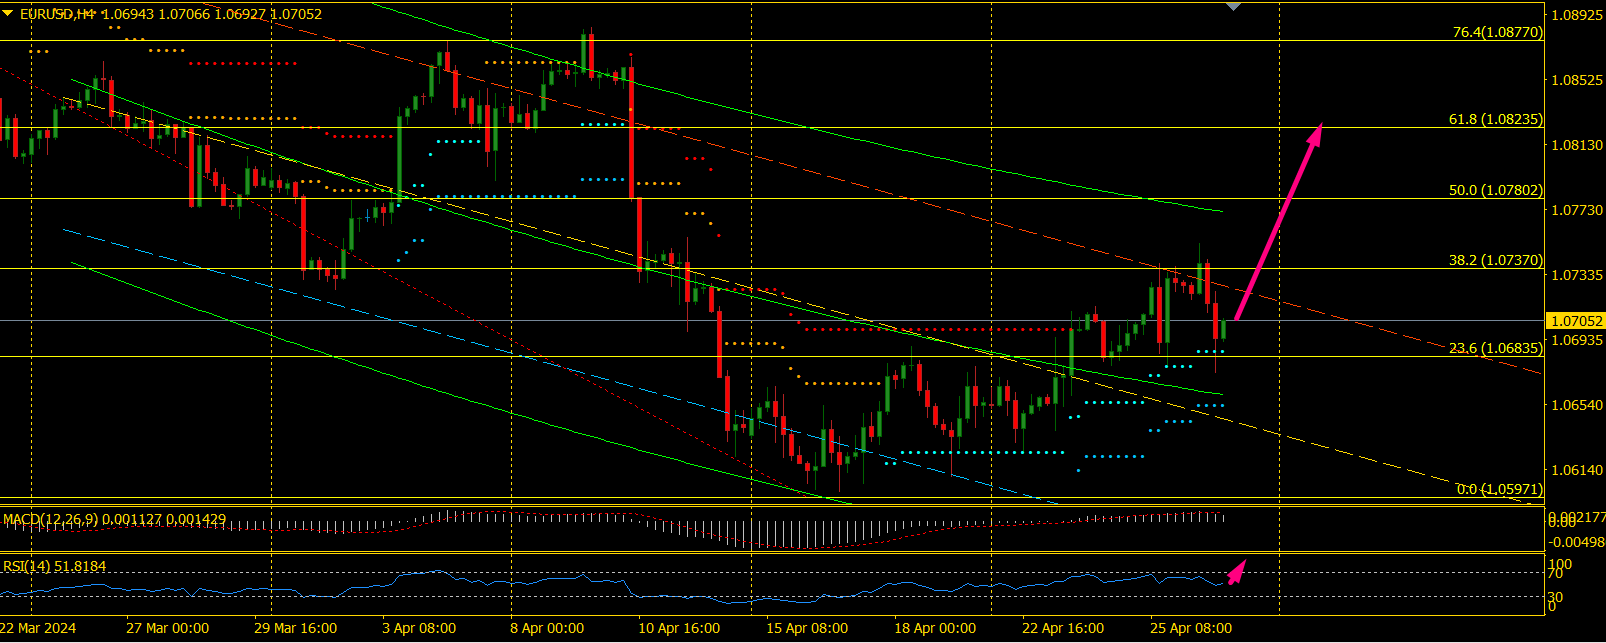
Best of luck to everyone! Analytical review and forecast of the movement of the Euro/US Dollar currency pair. Time frame 4 hours. We will draw up the most effective trading plan for the instrument, based on the indicators of the linear regression indicator Extended Regression StopAndReverse in combination with the popular technical analysis indicators RSI and MACD, which provide a unique opportunity to competently enter the market and, with a high degree of probability, work out the received signal. After working out the forecast, we will choose the most successful exit point from the position to close the deal with the highest possible efficiency. To do this, we will stretch the Fibonacci grid onto the current extreme points on the chart and focus on the nearest Fibonacci correction levels. The main thing that immediately catches your eye is that on the attached chart, the first-degree regression line (golden dotted line), showing the direction and state of the current true trend on the selected time frame (time-frame H4), is located with a downward slope, which indicates a period of decreasing direction movement of the instrument and emphasizes the dominant power of sellers. In turn, the nonlinear channel (convex lines) used to predict the near future direction has a fairly noticeable downward slope. The nonlinear regression channel has crossed the golden line of the linear channel from top to bottom and shows a decrease in quotes. The price crossed the blue support line of the linear regression channel 2-nd LevelSupLine but reached the minimum value (LOW) of quotes of 1.05971, after which it stopped its decline and began to gradually grow. At this point, the instrument is trading at a price level of 1.07052. Based on all of the above, I expect market price quotes to return and consolidate above the 2-nd LevelSupLine channel line (1.07915) of the FIBO level of 50% and further movement upward to the golden average line LR of the linear channel 1.08320, coinciding with the Fibo level of 61.8 %. Note that the auxiliary indicators RSI (14) and MACD are in the oversold area and also show a high probability of an increase in the price of the instrument.
*L'analyse de marché présentée est de nature informative et n'est pas une incitation à effectuer une transaction
 Français
  Русский
 English
 Bahasa Indonesia
 Bahasa Malay
 ไทย
ไทย Español
 Deutsch
 Български
 Tiếng Việt
 中文
中文 বাংলা
বাংলা हिन्दी
 Čeština
 Українська
 Română