 Bahasa Indonesia
  Русский
 English
 Bahasa Malay
 ไทย
ไทย Español
 Deutsch
 Български
 Français
 Tiếng Việt
 中文
中文 বাংলা
বাংলা हिन्दी
 Čeština
 Українська
 Română

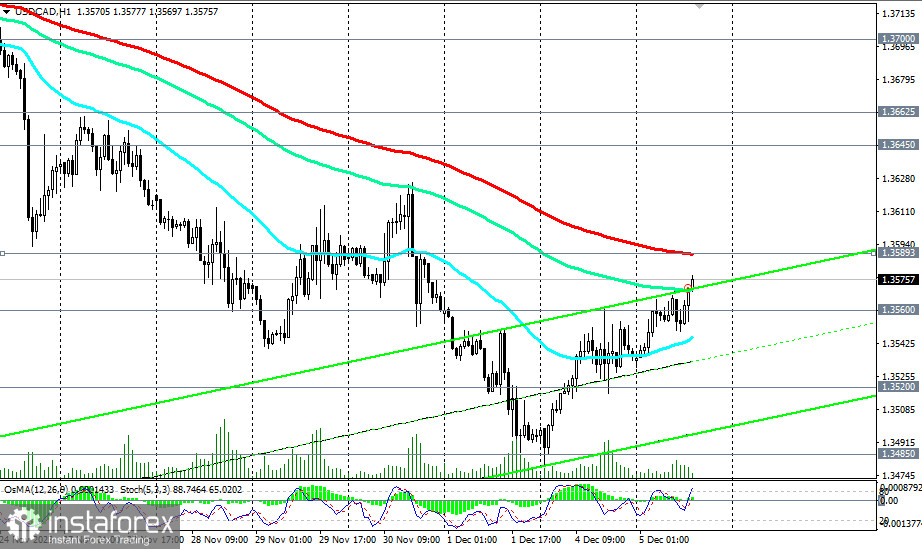
In anticipation of Wednesday's Bank of Canada meeting, USD/CAD is rising. As of writing, the pair was trading near the 1.3575 level.
During Tuesday's European trading session, the price broke a crucial resistance level of 1.3560 (144 EMA on the daily chart) and is moving towards a significant short-term resistance level of 1.3589 (200 EMA on the 1-hour chart). Its breakout will be a confirming signal for the resumption of long positions.
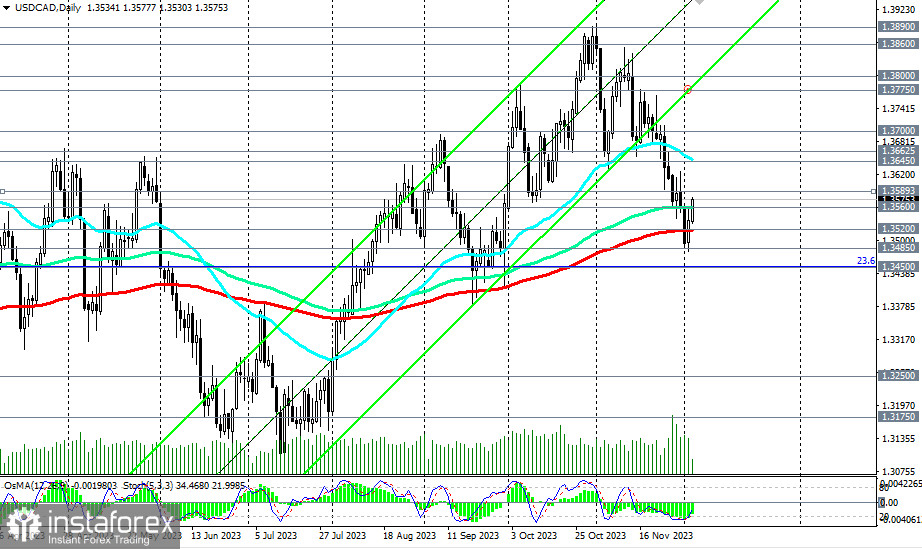
The immediate growth targets here will be resistance levels at 1.3645 (50 EMA on the daily chart) and 1.3662 (200 EMA on the 4-hour chart).
A breakout above the 1.3800 mark will signify the return of USD/CAD to the upward channel on the daily chart and the complete restoration of the bullish trend.
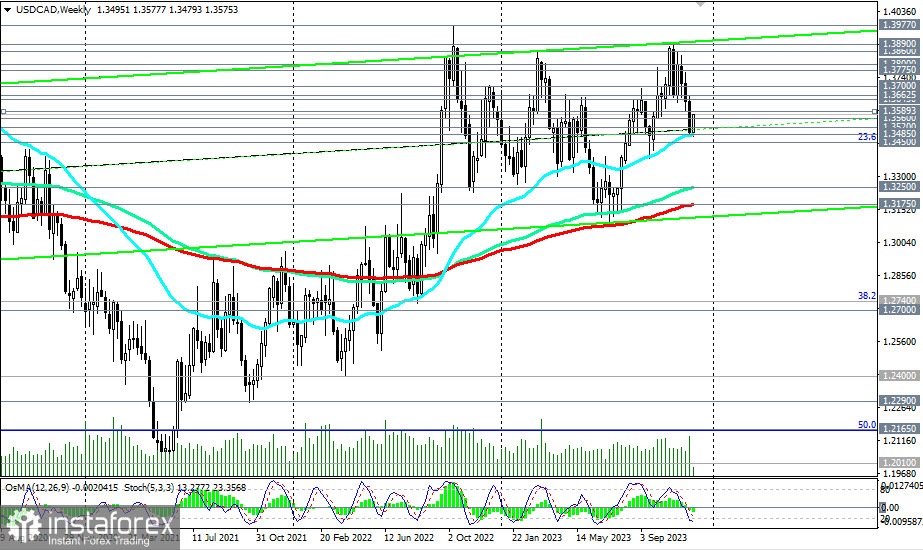
In an alternative scenario, the price will break the key medium-term support level of 1.3520 (200 EMA on the daily chart), and after breaking support levels at 1.3485 (50 EMA on the weekly chart), 1.3450 (23.6% Fibonacci level correction in the growth wave from the level of 0.9700 to 1.4600, reached in June 2016), it will continue to decline towards key support levels 1.3250, 1.3200, 1.3175 (200 EMA on the weekly chart), again making short positions preferable.
Their breakdown, in turn, will return USD/CAD to the long-term bearish market zone.
Support levels: 1.3560, 1.3520, 1.3500, 1.3485, 1.3450, 1.3400, 1.3250, 1.3200, 1.3175
Resistance levels: 1.3589, 1.3600, 1.3645, 1.3662, 1.3700, 1.3775, 1.3800, 1.3860, 1.3890, 1.3900, 1.3970, 1.4000
Trading scenarios:
Alternative scenario: Sell Stop 1.3550. Stop-Loss 1.3610. Targets 1.3520, 1.3500, 1.3485, 1.3450, 1.3400, 1.3250, 1.3200, 1.3175
Main scenario: Buy Stop 1.3610. Stop-Loss 1.3550. Targets 1.3645, 1.3662, 1.3700, 1.3775, 1.3800, 1.3860, 1.3890, 1.3900, 1.3970, 1.4000
"Targets" correspond to support/resistance levels. This also does not mean that they will necessarily be reached but can serve as a guideline when planning and placing your trading positions.