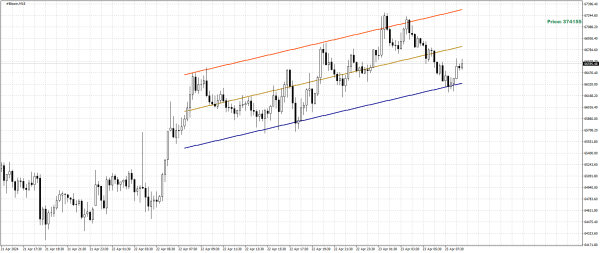
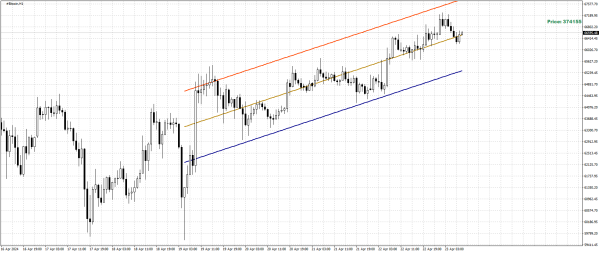
#Bitcoin Good day to everyone! The channel slope of the linear regression is upwards on the M15 chart. This indicates buyer strength, attempting to rise to the level of 67321.31. Upon reaching the target, movement will slow down. Due to weakening, volatility will decrease, the market will fade, and a correction will be needed. Buying at the upper channel should be avoided, it is necessary to wait for a correction to 66336.40. This level can be considered for entry for buying. If the price consolidates below 66336.40, the bear will show itself, potentially pushing the market down. Therefore, buying under these circumstances becomes unattractive. The channel slope angle indicates how active the bull is, the greater the angle, the stronger the buyer. A strong channel slope angle is usually a sign of market news action, contributing to good movement. The main linear regression channel located on the H1 chart determines the trend. The M15 channel is auxiliary, currently complementing the bullish picture, highlighting the upward trend. Channels moving in the same direction can characterize a bullish sentiment for this instrument. In case of a signal break on the lower timeframe, one should expect a decline to the level of 65314.85. From there, buying can be reconsidered up to 67737.87. At the upper channel boundary, when the bulls are present, I am fence-sitting with both buying and selling, which are currently risky for me. My trading principle is to trade in the direction of the H1 channel movement, as it is my primary one. It is beneficial to refine entries on the lower channel and work during strong movements when corrections are minimal.
*Analisis pasaran yang dipaparkan di sini hanya bertujuan untuk meningkatkan kesedaran anda, tetapi bukan sebagai petunjuk untuk anda melakukan perdagangan
 Bahasa Malay
  Русский
 English
 Bahasa Indonesia
 ไทย
ไทย Español
 Deutsch
 Български
 Français
 Tiếng Việt
 中文
中文 বাংলা
বাংলা हिन्दी
 Čeština
 Українська
 Română