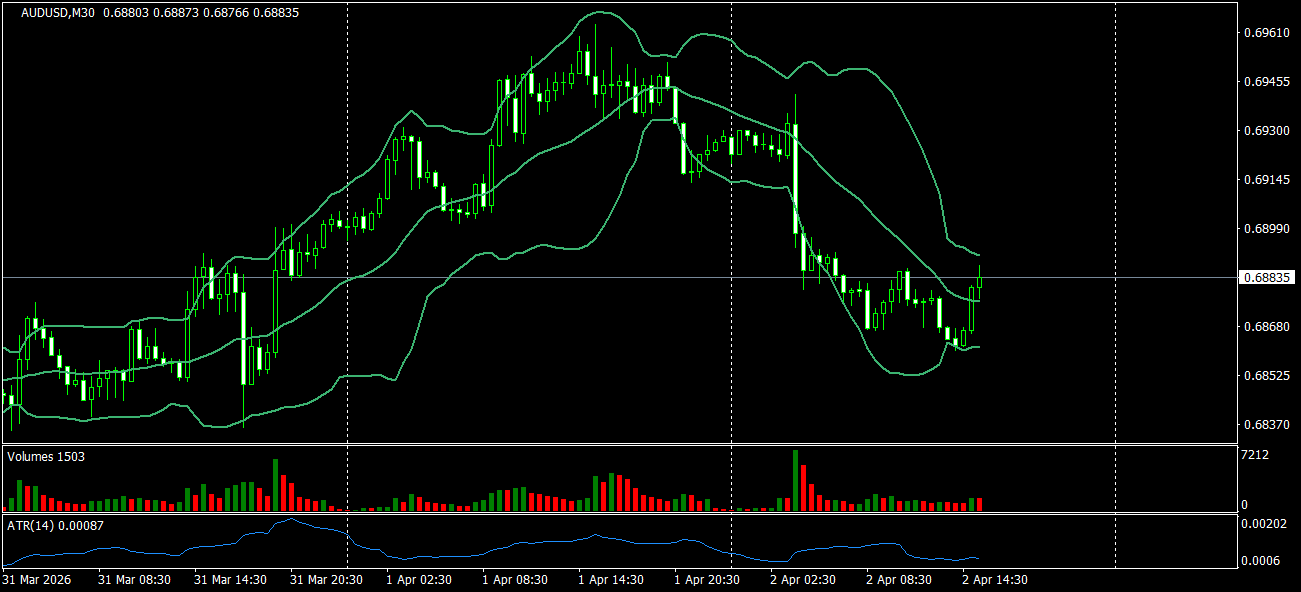

Hello! Currently, I am actively trading the AUDUSD currency pair using a 30-minute timeframe, based on Bollinger Bands indicator data and vertical tick volumes. The quote is at the level of 0.68834, and its positioning at the upper bounds of the Bollinger Bands confirms the potential for bullish momentum. At the moment, I am experimenting with opening a long position, starting from the current prices and aiming towards the level of 0.68904, corresponding to the upper Bollinger Bands boundary. I am carefully monitoring the formation of vertical volumes. I plan to close the position once the level of 0.68904 is reached, but with a stable volume growth, I consider the possibility of holding the position even higher. Key aspects of my strategy include considering market volatility and paying attention to the level of 0.68759, which is the middle of the Bollinger Bands indicator. If the AUDUSD price drops below 0.68759, it will be a signal to close the long position at a loss, as well as an opportunity to consider trading downwards. My strategy is flexible and always adjusts to the current market dynamics. I am ready to adapt my actions to changing conditions and make appropriate decisions.
*The market analysis posted here is meant to increase your awareness, but not to give instructions to make a trade
 Português
  Русский
 English
 Bahasa Indonesia
 Bahasa Malay
 ไทย
ไทย Español
 Deutsch
 Български
 Français
 Tiếng Việt
 中文
中文 বাংলা
বাংলা हिन्दी
 Čeština
 Українська
 Română