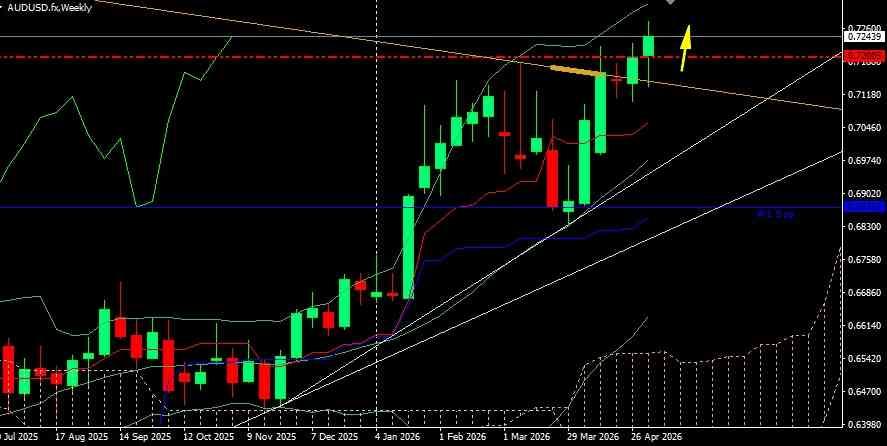
I have analyzed the weekly chart of AUD/USD, and you know, the situation looks very uncertain right now. We are almost at a strong resistance level around 0.7240–0.7260. On the chart, buyers are trying to hold above the main descending line, which has been pressing on the pair for months, and it seems to me that buyers want to change the course. Technically, at the moment, the price breaking out of the Ichimoku cloud upwards gives a significant bullish signal on the weekly chart. The Bollinger Bands are also expanding, showing an increase in volatility, and the price is confidently moving along the upper boundary. Here's one thing to note — the last candle closed with a long upper wick at the previous resistance. The last candle indicates that sellers are holding their ground, yes, sellers will not give up the level without a fight. For the upcoming week, the scenario is as follows: if we do not immediately overcome 0.7260, then there will likely be a pullback to the broken line or to the central Bollinger Band around 0.7100–0.7120 to gather strength. If the week starts above 0.7260 with a strong body, then the next target will be around 0.7400.
*The market analysis posted here is meant to increase your awareness, but not to give instructions to make a trade
 Português
  Русский
 English
 Bahasa Indonesia
 Bahasa Malay
 ไทย
ไทย Español
 Deutsch
 Български
 Français
 Tiếng Việt
 中文
中文 বাংলা
বাংলা हिन्दी
 Čeština
 Українська
 Română