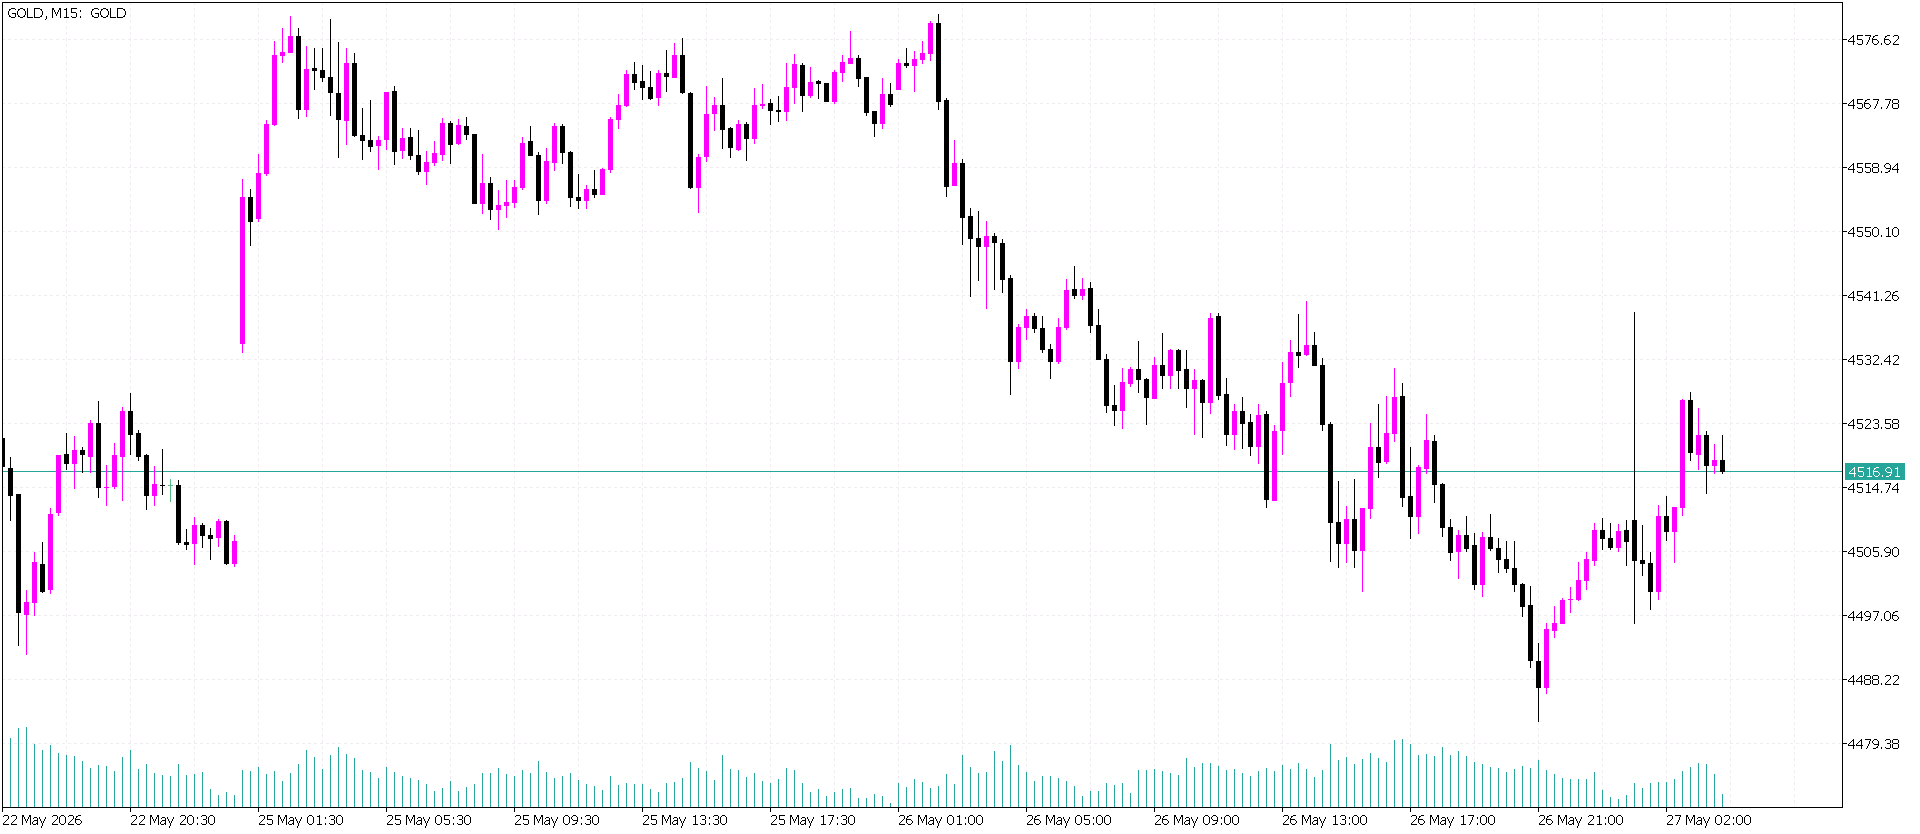
Based on the provided GOLD M15 chart data, the price action reveals a
clear and sustained bearish trend that has been steadily grinding lower. The market has declined from a high near
4576.62 down to a current low of
4479.38, establishing a clean sequence of lower highs and lower lows. The structure shows consistent selling pressure with minimal counter-trend rallies, indicating that sellers remain firmly in control. The recent price action suggests a potential pause or consolidation near the lows, but no reversal signals are present.
Technical Structure & Critical Levels The market structure is
bearish on the M15 timeframe, characterized by a descending channel with persistent selling pressure.
Immediate Resistance: 4488.22 - 4497.06 (First supply zone & recent broken support).
Key Resistance (Bearish Invalidation): 4505.90 - 4514.74 (Stronger resistance zone; reclaiming this would pause the downtrend).
Primary Support: 4479.38 (Current session low & critical level).
Breakdown Target: 4470.00 →
4460.00 →
4450.00.
Trading Plan & Scenarios 1. Bearish Scenario (Continuation - Dominant Bias): The path of least resistance is down. The strategy favors selling rallies into resistance or selling a breakdown of the current low.
Action 1 (Sell the Rally): Look for price to retrace into the
4488 - 4497 resistance zone and show bearish rejection signals.
Entry Zone: 4490 - 4497 on bearish candlestick confirmation (e.g., bearish engulfing, pin bar).
Target: 4479 →
4470.
Stop-Loss: Above
4505.
Action 2 (Breakdown Sell): A decisive M15 close below
4479.38 confirms bearish momentum continuing.
Entry: On a retest of
4478-4482 as new resistance, or on the break below
4476.
Target: 4470 →
4460.
Stop-Loss: Above
4490.
2. Bullish Scenario (Reversal / Correction): A bullish reversal would require a swift recovery above the established resistance sequence.
Trigger: A strong M15 close back above
4505.90, and more convincingly above
4514.74.
Implication: Would break the pattern of lower highs and suggest a deeper correction toward
4523 is possible.
Action: Consider long positions only on a confirmed recovery above
4510.
Entry Zone: 4505 - 4515 on a confirmed breakout pullback.
Target: 4514 →
4523.
Stop-Loss: Below
4497.
Summary GOLD on the M15 chart is in a
consistent bearish trend, steadily declining from
4576.62 to
4479.38. The strategy
favors selling rallies into the
4490-4497 resistance zone or selling a breakdown below
4479, targeting
4470 and
4460. The bearish outlook remains valid as long as price stays below
4505. A recovery above this level would signal a potential short-term trend shift. Trade with the trend—sell rallies, not breaks.
*The market analysis posted here is meant to increase your awareness, but not to give instructions to make a trade
 Português
 Русский
 English
 Bahasa Indonesia
 Bahasa Malay
 ไทย
ไทย Español
 Deutsch
 Български
 Français
 Tiếng Việt
 中文
中文 বাংলা
বাংলা हिन्दी
 Čeština
 Українська
 Română
