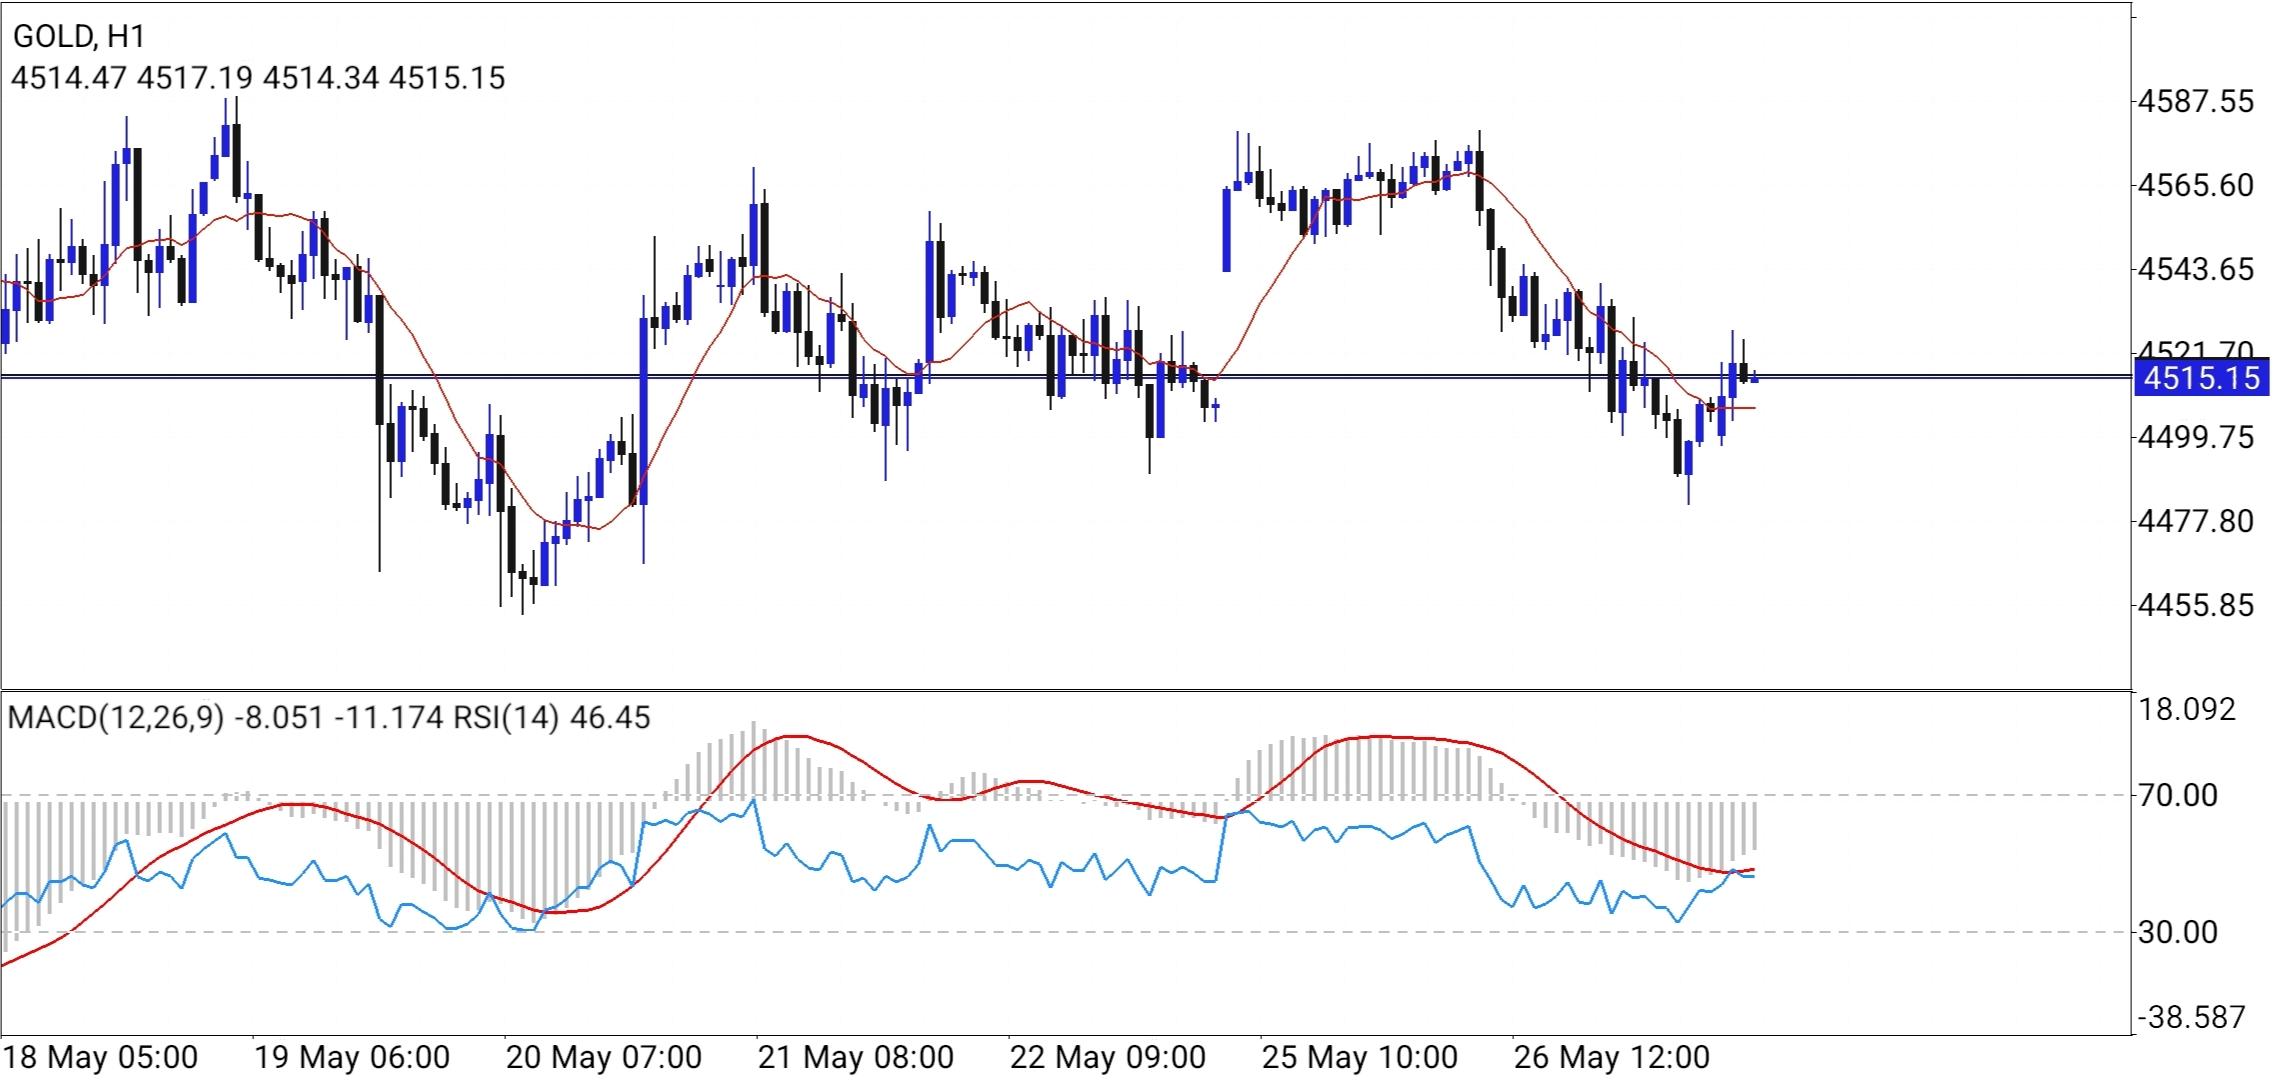
 GOLD H1 Timeframe Analysis 27 May 2026
 The provided H1 chart for Gold (XAU/USD) displays a market currently navigating a period of consolidation and indecision around a key horizontal level near 4515.15. Price action shows a series of fluctuations without a clear, sustained directional bias, indicating a noisy environment where buyers and sellers are competing for control. The price is hovering tightly around the moving average (the red line), which acts as a dynamic support/resistance level; when the price remains this close to the average, it often signifies that momentum is stalling and that the market is in a ranging phase rather than a trending one. Analyzing the oscillators at the bottom provides further insight: the MACD (Moving Average Convergence Divergence) histogram shows weakening momentum, with the lines converging, which often precedes a potential breakout or a continuation of the current sideways movement. Simultaneously, the RSI (Relative Strength Index) is positioned in the neutral zone, neither overbought nor oversold, reinforcing the lack of strong directional conviction. The combination of price sticking to the moving average and neutral oscillator readings suggests that the market is awaiting a catalyst—either fundamental news or a significant volume spike—to break out of this narrow range. In such conditions, attempting to trade aggressive breakouts can be risky, as the likelihood of false breakouts or whipsaws increases significantly.
Trading Summary and Outlook: • Market Phase: Consolidation / Ranging. • Key Level: The 4515.15 horizontal line is the current pivot point. • Technical Bias: Neutral, pending a decisive break of the range. • Strategy: Wait for Confluence: Avoid impulsive entries while the price is tightly compressed around the moving average. • Breakout Scenario: If the price breaks decisively above the local resistance with increased volume, a short-term long position could be considered, targeting the previous swing highs. • Breakdown Scenario: Conversely, a sustained break below the current support level, confirmed by the RSI trending downward and the MACD lines diverging bearishly, would favor a short position.
Risk Management: Because Gold is prone to high volatility, any trade should be protected with a stop-loss placed logically outside the consolidation zone (e.g., above the recent swing high for a short, or below the recent swing low for a long). Utilizing the Average True Range (ATR) can help set appropriate stops to account for the current market noise.
*The market analysis posted here is meant to increase your awareness, but not to give instructions to make a trade
 Português
 Русский
 English
 Bahasa Indonesia
 Bahasa Malay
 ไทย
ไทย Español
 Deutsch
 Български
 Français
 Tiếng Việt
 中文
中文 বাংলা
বাংলা हिन्दी
 Čeština
 Українська
 Română
