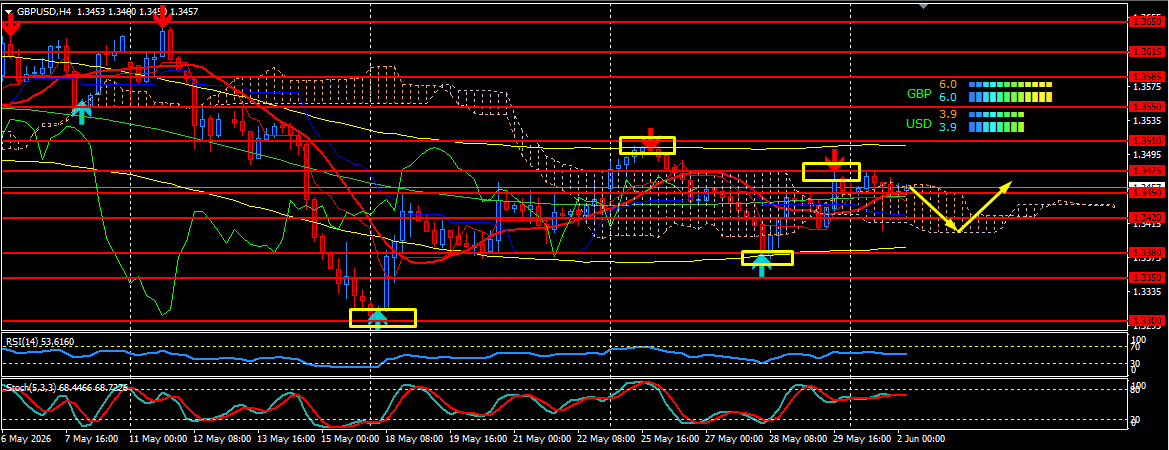
Hello traders! On the four-hour chart of the GBP/USD currency pair, we observe a sideways movement, with decreasing deviations leading the pair into a "wedge" state, and this may continue at least until significant drivers are received from the fundamentals. Currently, we can see that the latest peak of the pair is marked by the "Zigzag" indicator below the previous value, while the minimum is higher. The recent dynamics of the pair's movement also suggest a narrowing trading range. Therefore, I assume that in the near future the price of GBP/USD will start to decline towards the support test at 1.3420, touching the lower boundary of the Ichimoku cloud, and later return to the middle of the 34th figure, where the Ichimoku indicator's median and the 14-period moving average line are currently intersecting, emphasizing the neutrality of the current positions. Additionally, the stochastic, although trading in the upper segment of the indicator's working area, also indicates a sideways movement, moving horizontally.
*The market analysis posted here is meant to increase your awareness, but not to give instructions to make a trade
 Português
  Русский
 English
 Bahasa Indonesia
 Bahasa Malay
 ไทย
ไทย Español
 Deutsch
 Български
 Français
 Tiếng Việt
 中文
中文 বাংলা
বাংলা हिन्दी
 Čeština
 Українська
 Română