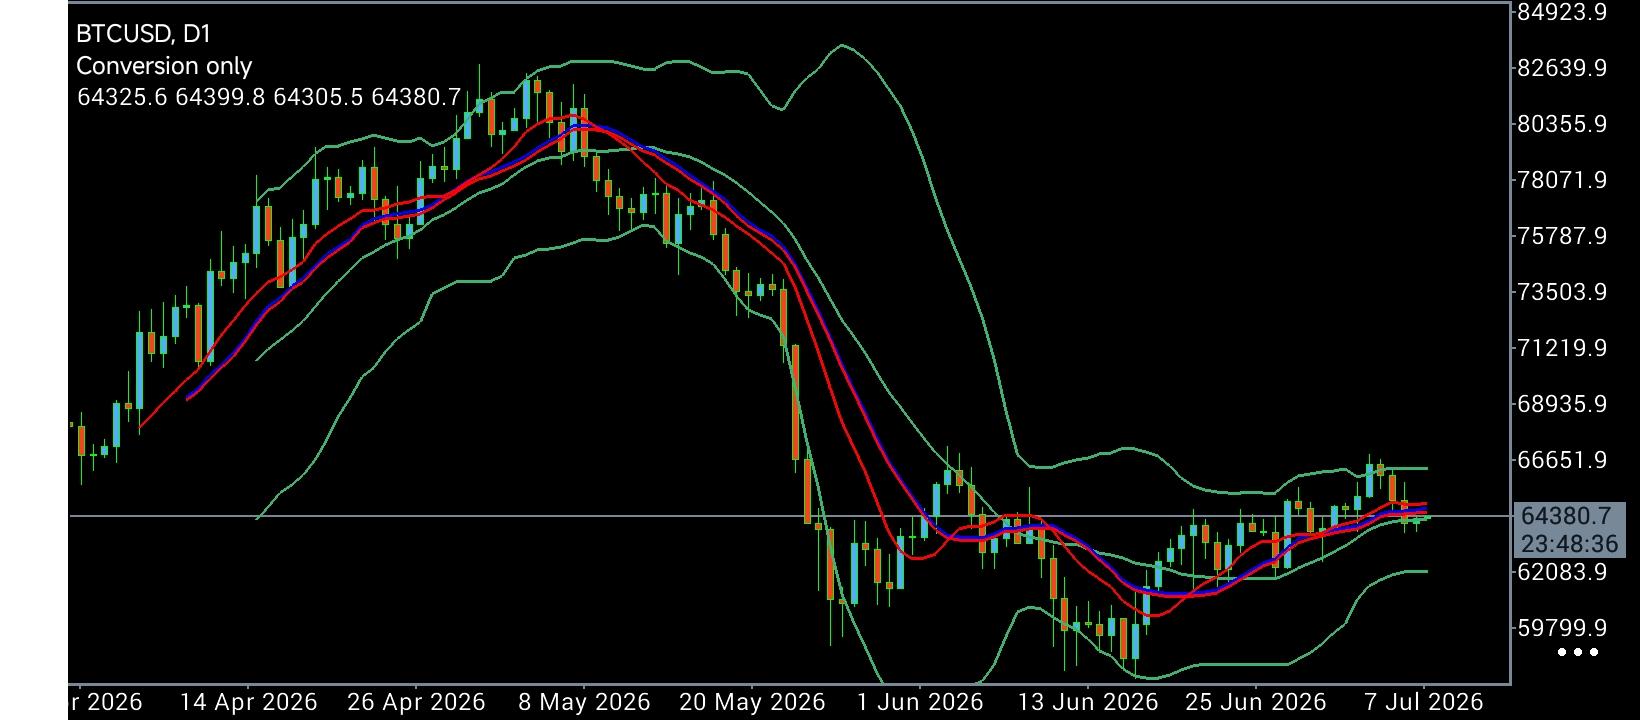
 The "Bollinger Compression": BTC/USD Compresses at 64,380.7 as Volatility Coil Prepares for Impulse
 The
BTC/USD daily chart through 7 July 2026 exhibits an active structural standoff, with Bitcoin stabilizing at
64,380.7 after the latest daily candle opened at
64,325.6, printing a session high of
64,399.8 and a low of
64,305.5. Over the preceding three-month sequence, price action cleanly bifurcated into three structural phases: an early-spring bullish impulse that topped near
82,639.9 on 8 May, a sharp distribution cascade taking price down to a capitulation low of
59,799.9 by 20 June, and a late-June recovery move that is now testing key resistance at the daily moving-average cluster and middle Bollinger Band. Having successfully flipped former static levels like
62,083.9 back into dynamic support, buyers face an overhead supply ceiling near
66,651.9—a breakdown level originating from early June that coincides with the middle Bollinger Band. Volatility has contracted significantly, causing the Bollinger Bands to squeeze around the
64,380.7 pivot while short-to-medium-term exponential moving averages (EMAs) converge in a tight bullish alignment, signaling that a major volatility expansion is imminent.
Technical Trend Structure: The 64,380.7 Convergence Matrix and Tactical Scenarios The daily trend architecture presents a neutral-to-bullish coiling pattern, with price action holding directly above short-term moving average support while remaining capped by higher-timeframe supply.
Technical Sentinel Price Node Structural Significance Macro Supply Zone 80,355.9 – 82,639.9 May distribution peak and major multi-month resistance ceiling.
Breakout Gateway 66,651.9 Middle Bollinger Band and primary structural breakdown origin.
Pivotal Equilibrium 64,380.7 Confluence of converging daily EMAs and daily candle open zone.
Primary Dynamic Floor 62,083.9 Upsloping moving-average support and higher-low structural floor.
Macro Floor 59,799.9 June capitulation swing low and critical macro trend line in the sand.
Bullish Breakout Scenario: A decisive two-day close above
66,651.9 validates the recovery structure off
59,799.9, triggering an upside volatility expansion toward
68,935.9 and exposing upper supply targets at
71,219.9 and
73,503.9.
Bearish Breakdown Scenario: A rejection at current levels leading to a daily close below
62,083.9 breaks the higher-low sequence, putting the moving averages back under pressure and exposing the
59,799.9 swing low. A breakdown beneath
59,799.9 would invalidate the counter-trend bounce entirely, targeting the
57,515.9 base.
Strategic Trading Decision Matrix: Setup Type Entry Trigger Primary Target (TP) Protective Stop (SL) Tactical Rationale Breakout Long Daily Close >
66,651.9 68,935.9 / 71,219.9 64,200.0 Momentum expansion play on Bollinger Band break and EMA fan-out.
Support Re-Test Daily Reversal at
62,083.9 66,651.9 / 68,935.9 60,950.0 High-R:R dip-buying opportunity at structural higher-low support.
Bearish Breakdown Daily Close <
62,083.9 59,799.9 / 57,515.9 64,500.0 Trend-continuation short targeting the lower range boundaries.
Key Technical Milestones: Immediate Resistance: 64,399.8 (Current candle high) followed by
66,651.9 (Middle Bollinger Band).
Critical Support Floor: 62,083.9 (EMA confluence) and
59,799.9 (June swing low).
*The market analysis posted here is meant to increase your awareness, but not to give instructions to make a trade
 Português
 Русский
 English
 Bahasa Indonesia
 Bahasa Malay
 ไทย
ไทย Español
 Deutsch
 Български
 Français
 Tiếng Việt
 中文
中文 বাংলা
বাংলা हिन्दी
 Čeština
 Українська
 Română
