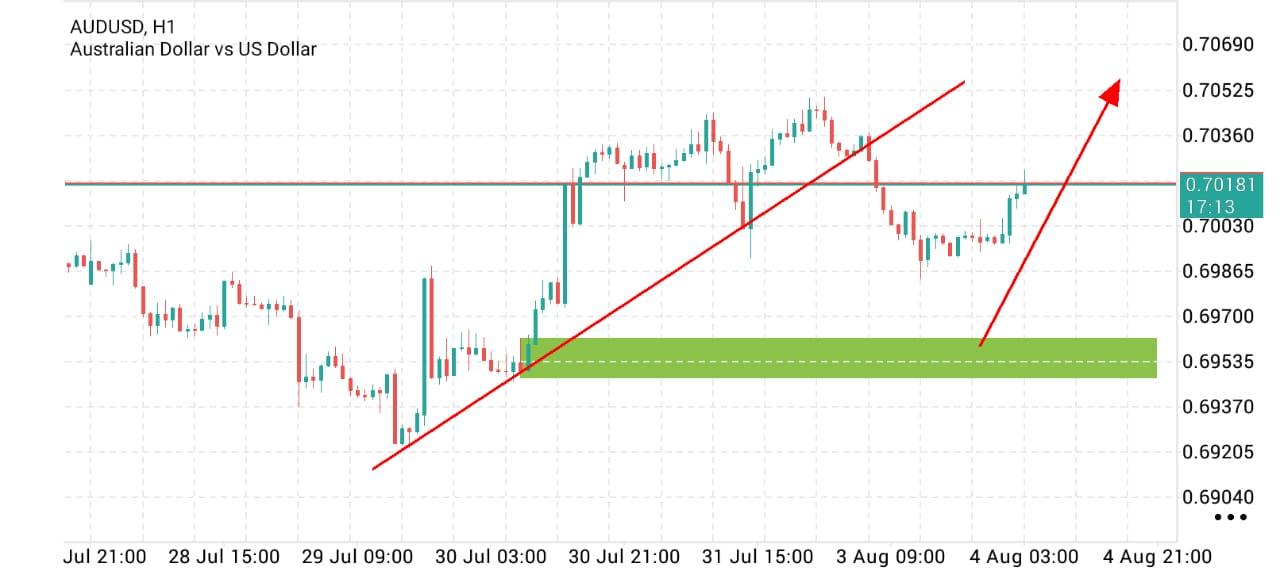
 AUDUSD H1 Technical Analysis *LOverall Trend Structure*
 On the H1 timeframe, AUDUSD has formed a clear bullish structure since the low around 0.69150 on July 29. The price action printed a higher low into the 0.69535 green support zone, then broke above prior swing highs near 0.70180. Currently trading at 0.70181 as of 17:13, the pair is holding above both the ascending trendline and the recent consolidation base. This sequence of higher lows and higher highs confirms that buyers remain in control on the intraday chart, with momentum favoring continued upside unless the structure breaks.
Key Support and Resistance Levels The most significant support is the green highlighted demand zone between 0.69480 and 0.69580. This area previously acted as a launch point on July 30 and has since been respected as price pulled back on Aug 3. A break and daily close below it would invalidate the short-term bullish bias. On the resistance side, the horizontal line at 0.70180 is the immediate level. Price is testing it now. Above that, the next measured target aligns with the extension of the ascending trendline near 0.70525, followed by 0.70690 which marks the top of the visible range. Trendline and Channel Dynamics
The red ascending trendline drawn from the July 29 low has contained all pullbacks so far. Each touch has produced buying interest, indicating it is acting as dynamic support. Additionally, the steeper red arrow projecting from the green zone suggests a potential acceleration channel. As long as H1 candles close above the main trendline, the bullish channel remains valid. A break below the trendline with increased volume would signal a shift to range trading or a deeper retracement toward 0.69865. Momentum and Price Behavior Price consolidated for nearly 24 hours between 0.70030 and 0.70180 after the rally from the green zone. The recent breakout candle above 0.70180 shows renewed buying pressure, with wicks being rejected on the sell side. There is no clear divergence on this timeframe, and the series of green candles following the Aug 3 dip indicates accumulation rather than exhaustion. The tight consolidation just under resistance followed by a push higher is a classic continuation pattern on H1.
Risk Scenario and Invalidation The bullish thesis is invalidated on a 2-candle H1 close below 0.69535. That would break both the trendline and the demand zone, likely triggering stops and opening a move back to 0.69370 and then 0.69205. Upside risk is a false breakout above 0.70180 followed by rejection, which could trap breakout buyers and cause a pullback to 0.70030. Until then, dips should be bought near the trendline or the green zone. Traders should watch for volume on the break of 0.70180 to confirm follow-through
*The market analysis posted here is meant to increase your awareness, but not to give instructions to make a trade
 Português
 Русский
 English
 Bahasa Indonesia
 Bahasa Malay
 ไทย
ไทย Español
 Deutsch
 Български
 Français
 Tiếng Việt
 中文
中文 বাংলা
বাংলা हिन्दी
 Čeština
 Українська
 Română
