 Ethereum (ETH/USD) Technical Analysis – Today’s Market Outlook
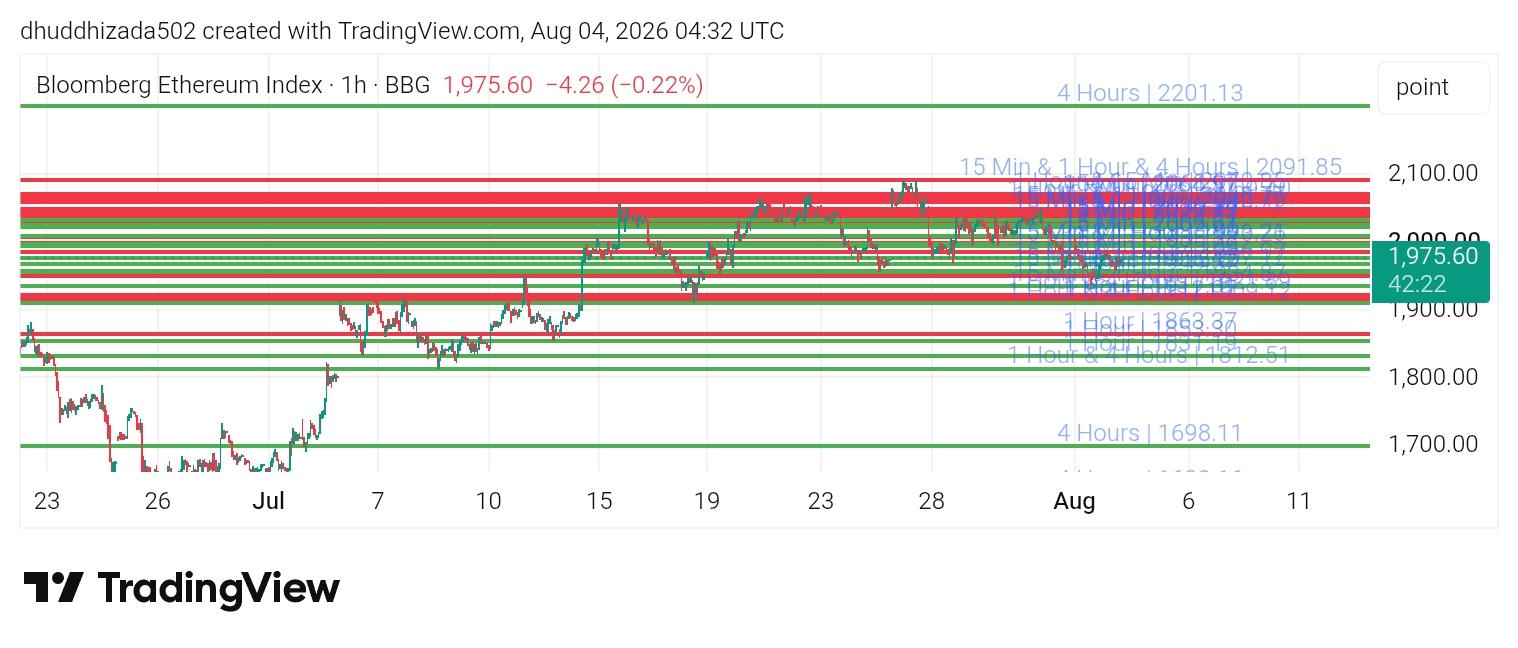
 Ethereum (ETH/USD) continues to attract strong attention from traders as price action remains active around important technical levels. After experiencing healthy volatility over the past few sessions, Ethereum is now attempting to establish a clearer direction. The market sentiment remains cautiously bullish, although traders should be prepared for short-term pullbacks before any significant upward continuation. On the daily chart, Ethereum is still trading above its medium-term trend support, indicating that buyers continue to defend key price zones. The overall structure remains constructive as long as higher lows continue to form. However, the market is approaching an area where profit-taking could temporarily slow bullish momentum. From a technical perspective, the 50-day moving average continues to trend above the 100-day moving average, reflecting positive momentum. Meanwhile, the price is also holding above the 200-day moving average, suggesting that the long-term trend remains bullish despite recent fluctuations. The Relative Strength Index (RSI) is hovering near the neutral-to-bullish region. This indicates that buying pressure is gradually increasing without the market becoming significantly overbought. If RSI pushes above the 60 level, it could strengthen the case for another bullish breakout. The MACD indicator also supports a positive outlook. The MACD line remains above the signal line while the histogram continues printing positive bars, showing that bullish momentum is still present. However, traders should monitor for any bearish crossover, as it could signal a temporary correction. On the four-hour chart, Ethereum has formed a series of higher highs and higher lows, which is one of the strongest technical signs of an ongoing uptrend. Buyers continue stepping into the market whenever the price revisits support areas. As long as this structure remains intact, the probability of further gains stays favourable. Immediate support is located near the recent swing low, where buyers previously entered the market aggressively. If this support holds, Ethereum could attempt another move toward the next resistance zone. A break below this support, however, may trigger additional selling pressure and lead to a deeper correction. The nearest resistance lies around the recent high. A successful breakout above this level with strong trading volume could open the path toward higher psychological price targets. Volume confirmation will be essential because breakouts without strong participation often fail and result in false signals. Volume analysis shows moderate buying activity. Although trading volume has not reached extreme levels, it remains healthy enough to support the current trend. Increasing volume during bullish candles would provide stronger confirmation that institutional buyers are participating. From a price action perspective, Ethereum continues respecting its ascending trendline. Recent candlestick formations suggest buyers are defending dips rather than chasing higher prices. This behaviour often reflects a healthy trend where market participants accumulate during pullbacks instead of buying emotional breakouts. Fundamental factors also continue supporting Ethereum over the medium term. Growing institutional interest in digital assets; continued development within the Ethereum ecosystem, decentralised finance (DeFi), and staking participation; and expanding blockchain adoption all contribute to positive long-term sentiment. At the same time, traders should remain aware of upcoming U.S. economic data, Federal Reserve comments, and overall cryptocurrency market sentiment, as these events can create sharp short-term volatility. For intraday traders, patience remains important. Instead of entering trades after large bullish candles, waiting for pullbacks toward established support levels may offer more favourable risk-to-reward opportunities. Conservative traders may also prefer waiting for confirmation after resistance breakouts before opening new positions. Swing traders should monitor whether Ethereum continues producing higher daily closes. Sustained closes above resistance would indicate buyers remain in control, while repeated rejection near resistance could lead to consolidation before the next major move. Risk management remains essential regardless of market direction. Every trade should include a predefined stop-loss, realistic profit target, and appropriate position size. Cryptocurrency markets are highly volatile, and disciplined money management often determines long-term trading success more than individual trade accuracy. Overall, Ethereum maintains a constructive technical outlook with bullish momentum still visible across multiple timeframes. As long as key support zones remain intact and momentum indicators continue favouring buyers, the probability of additional upside remains stronger than the downside risk. Nevertheless, traders should remain flexible, monitor market news closely, and wait for proper confirmation before making trading decisions.
Key Technical Levels Trend: Bullish
Immediate Support: Recent swing low
Major Support: Ascending trendline zone
Immediate Resistance: Recent daily high
Next Resistance: Higher psychological breakout zone
Trading Outlook: Ethereum remains bullish while trading above key support levels. A confirmed breakout above resistance could extend the rally, whereas a break below support may trigger a short-term correction before buyers attempt another recovery.
*The market analysis posted here is meant to increase your awareness, but not to give instructions to make a trade
 Português
 Русский
 English
 Bahasa Indonesia
 Bahasa Malay
 ไทย
ไทย Español
 Deutsch
 Български
 Français
 Tiếng Việt
 中文
中文 বাংলা
বাংলা हिन्दी
 Čeština
 Українська
 Română
