 Treasury Squeeze Sparks Crypto Breakout: BTC Surges Toward $72,000 as Macro Liquidity Unleashes Surge
 The
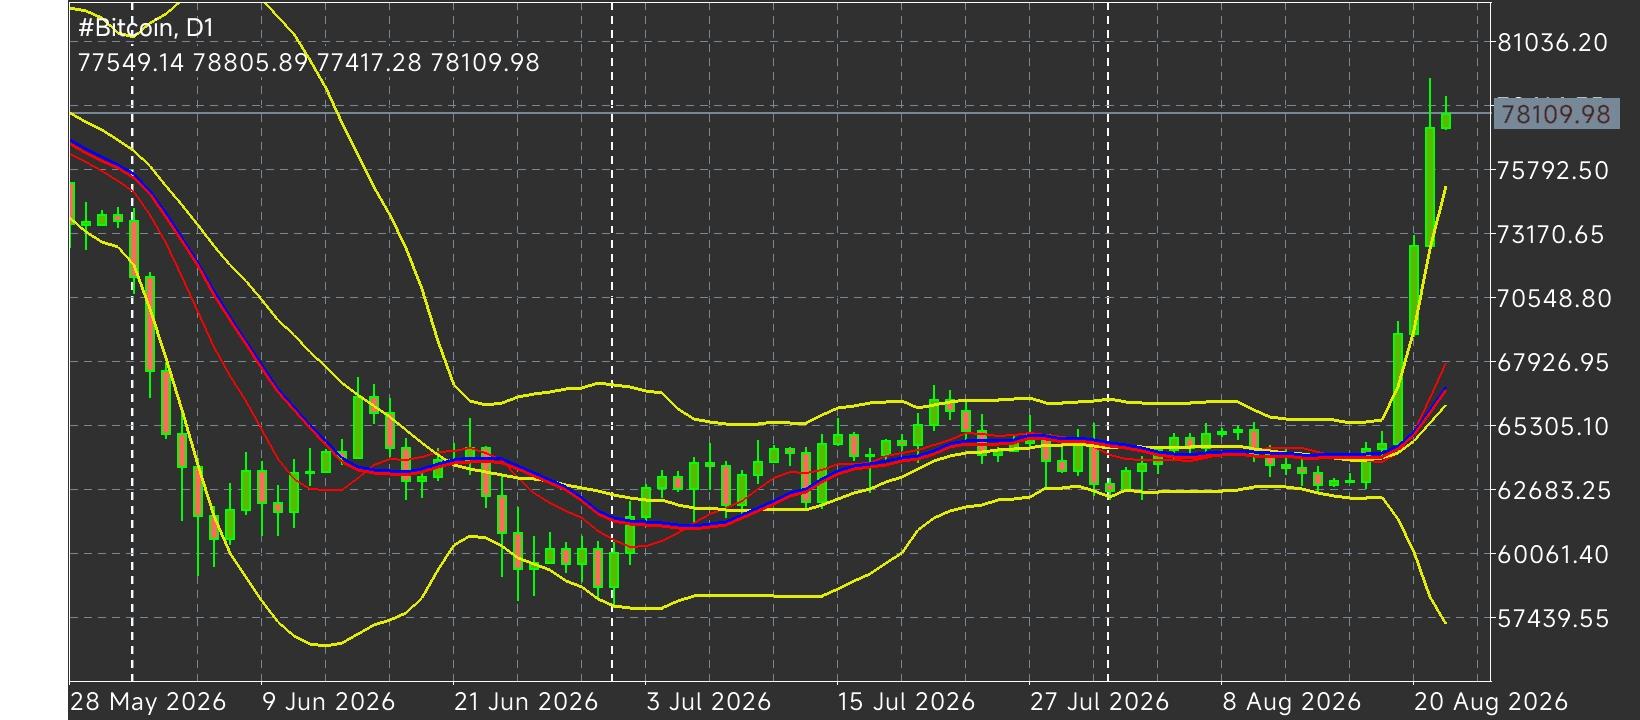
Bitcoin (BTC/USD) daily chart shows an explosive bullish extension during Thursday's trading session, with price surging toward the
$72,000.00 region. This massive expansion in crypto market valuations follows an unexpected liquidity injection from the US Department of the Treasury, which announced it will double the size of its liquidity-support buyback operations for longer-dated nominal coupon Treasury securities from $2 billion to at least $4 billion per operation. The announcement eased broader macro credit concerns, ignited risk-on market sentiment, and triggered a brutal short squeeze across crypto derivatives venues. CoinGlass liquidation data revealed over $3 billion in liquidations across the broader crypto market within 24 hours, with heavily crowded short positions accounting for 96.6% of Bitcoin exposure and driving $1.45 billion in BTC short liquidations alone—the largest single-day wipeout event since October. This derivatives squeeze was further reinforced by massive institutional spot ETF inflows totaling $517.19 million on Wednesday, marking the highest single-day spot ETF demand since early May.
The Primary Accumulation & Multi-Month Base: Prior to this explosive breakout, Bitcoin completed a multi-month bottoming phase anchored around its yearly low of
$57,800.00 (recorded on July 1) up through intermediate base support near
$62,300.00. Institutional demand steadily absorbed selling pressure across key Fibonacci retracement levels (23.6% at
$62,586.00 and 38.2% at
$65,547.00), establishing a firm structural floor that served as the primary launchpad for the current macro cycle resumption.
The Impulsive Breakout & Trend Acceleration: A powerful high-volume impulse drove BTC cleanly through major dynamic resistance lines, reclaiming the 50-day Exponential Moving Average (EMA) at
$64,860.00, the 100-day EMA at
$66,543.00, and the critical 61.8% Fibonacci retracement level at
$70,333.00 (drawn from the May 26 high of $78,080.00 to the July low). The price surge reclaimed the major 200-day EMA at
$71,463.00, with momentum oscillators confirming strong buyer dominance as the 14-period Relative Strength Index (RSI) pushed into overbought territory near 79.00 alongside a strongly positive Moving Average Convergence Divergence (MACD) expansion.
High-Level Consolidation & Resistance Testing: Currently trading near
$72,000.00, Bitcoin is coiling directly beneath major upper Fibonacci supply zones. The market is digesting its rapid short-squeeze gains, maintaining high-level structural stability above its key moving average cluster as institutional spot ETF inflows provide an ongoing underlying bid for the asset. From a price level perspective, the technical architecture is clearly defined across key horizontal, dynamic, and Fibonacci zones:
Overhead Resistance Targets: The immediate technical hurdle aligns with the 78.6% Fibonacci retracement level near
$73,740.00. A sustained daily close above $73,740.00 clears the path for a continuation toward the May 26 swing high at
$78,080.00 and secondary expansion targets near psychological record highs.
Key Support Boundaries: To the downside, immediate dynamic support rests at the 200-day EMA near
$71,463.00, followed by the 61.8% Fibonacci retracement floor at
$70,333.00. Below these levels, secondary demand is stacked between the 50% Fibonacci level at
$67,940.00 and the 100-day EMA at
$66,543.00 (confluent with horizontal support at
$66,500.00), with the 38.2% Fibonacci retracement at
$65,547.00 and 50-day EMA at
$64,860.00 serving as deeper structural floors. The overall trend structure for Bitcoin remains decisively bullish on daily and weekly charts. The sequence of higher highs and higher lows remains fully intact as long as price holds above the
$70,333.00–$71,463.00 support cluster. Backed by institutional spot ETF demand and favorable macro liquidity conditions, the path of least resistance points toward
$73,740.00 and
$78,080.00, with any short-term pullbacks expected to encounter strong buying interest above former breakout resistance.
*The market analysis posted here is meant to increase your awareness, but not to give instructions to make a trade
 Português
 Русский
 English
 Bahasa Indonesia
 Bahasa Malay
 ไทย
ไทย Español
 Deutsch
 Български
 Français
 Tiếng Việt
 中文
中文 বাংলা
বাংলা हिन्दी
 Čeština
 Українська
 Română
