Based on the provided
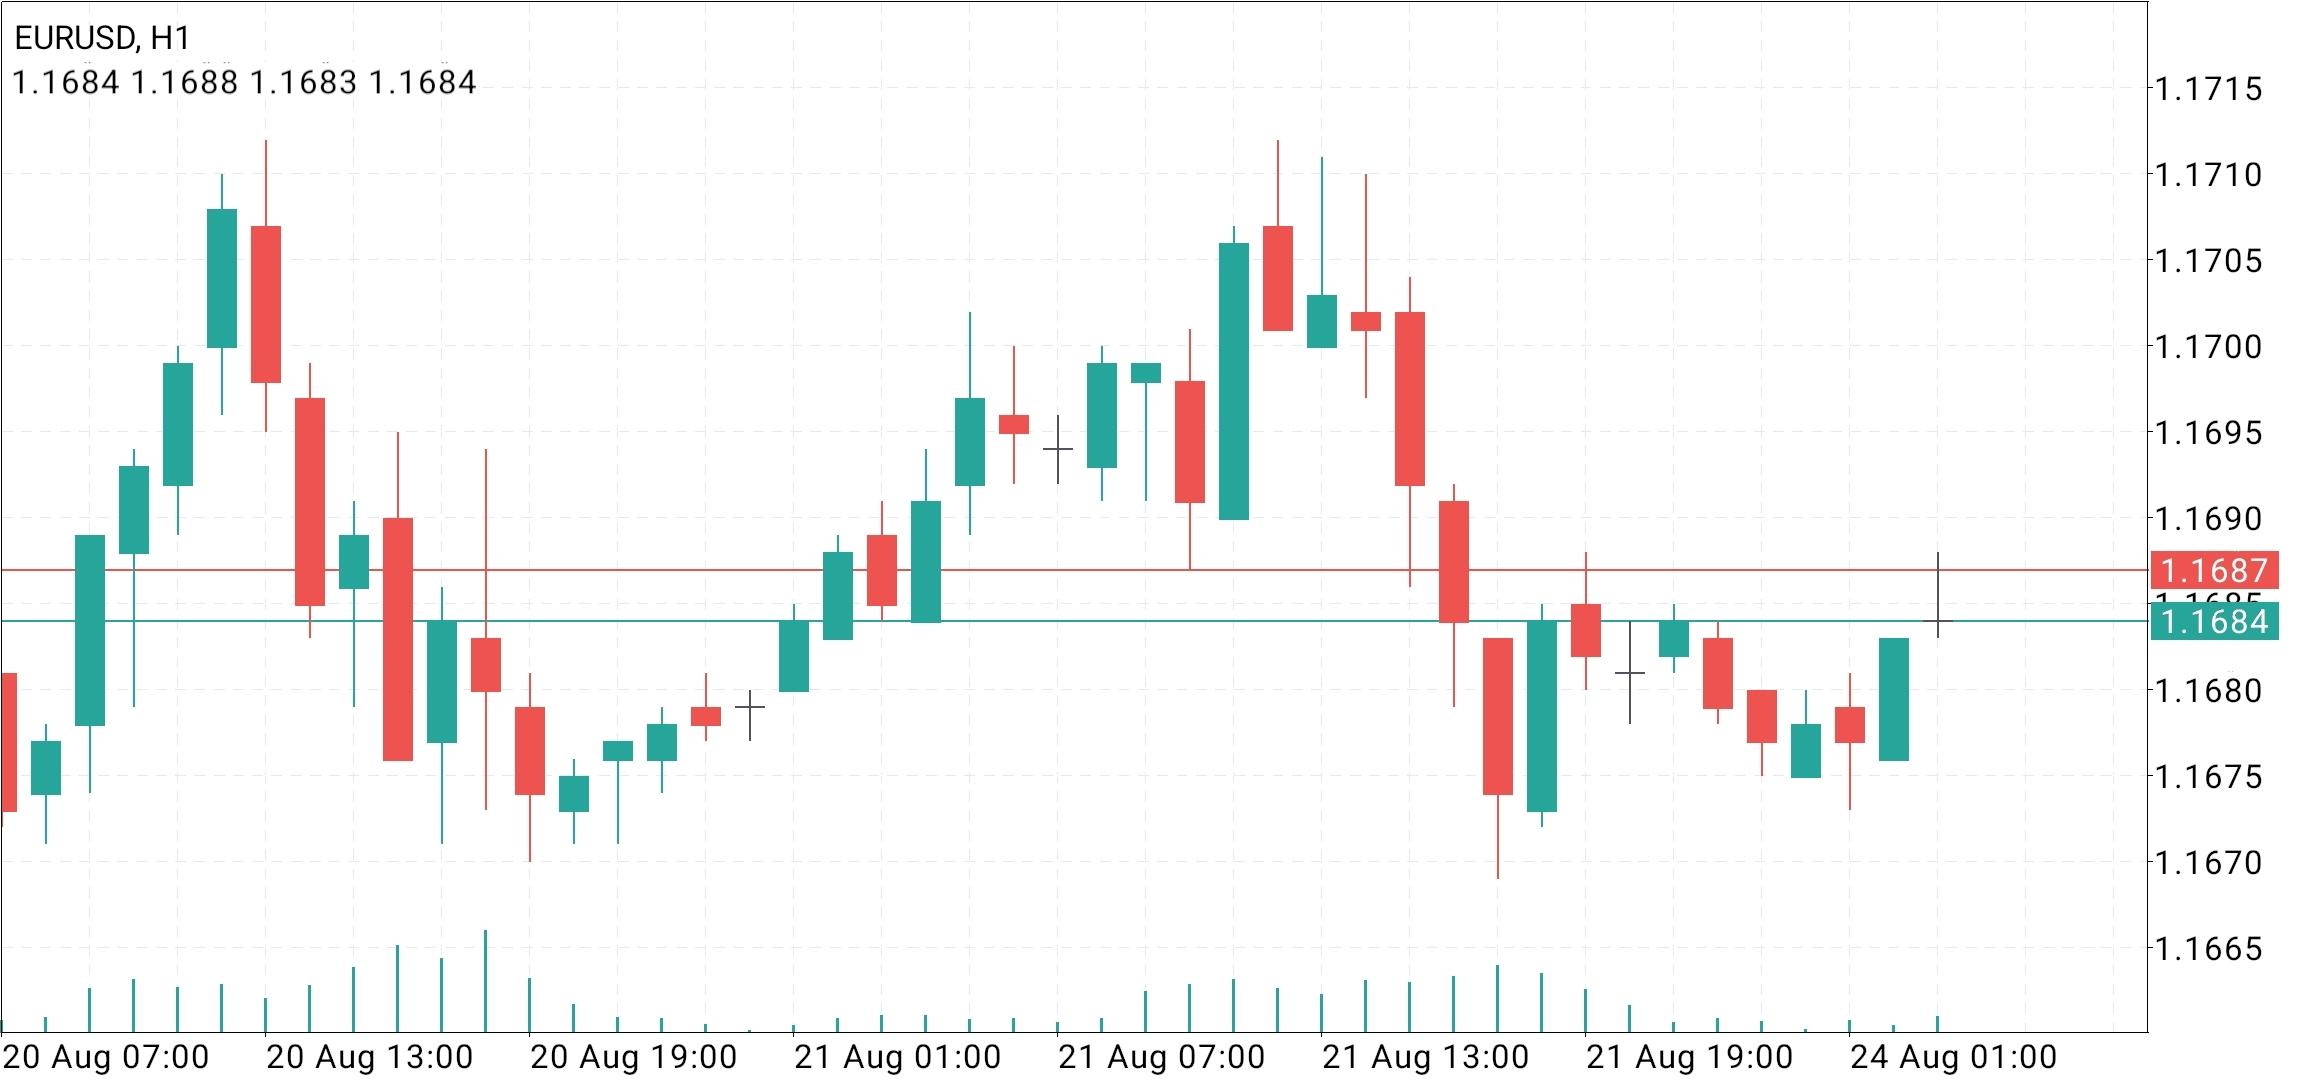
EUR/USD H1 chart data, the pair is in a consolidation phase after a strong uptrend. The sequence shows a peak at 1.1715 (August 21st, 07:00), followed by a pullback to 1.1675 (August 21st, 19:00), and then a recovery to 1.1684 (August 24th, 01:00). The overall structure is a range-bound market between 1.1675 (support) and 1.1715 (resistance), with the current price near the middle of the range at 1.1684. This indicates indecision and a potential buildup for the next breakout, as the pair has failed to break either side decisively over multiple sessions.
Technical Analysis – Trend & Key Levels: The H1 chart reveals a horizontal consolidation with the following key levels: · Immediate resistance: 1.1700 (psychological level) and 1.1715 (the cycle high). · Stronger resistance: 1.1725 (next overhead) if momentum resumes. · Immediate support: 1.1675 (the recent low) and 1.1683 (the breakout level). · Major support: 1.1650 (the previous consolidation zone). Momentum is neutral, as the pair has made lower highs (1.1715 → 1.1708 → 1.1700) and higher lows (1.1675 → 1.1683 → 1.1684), forming a contracting triangle or a symmetrical wedge. This pattern typically resolves with a sharp breakout, but the direction is uncertain. The RSI (not shown) would likely be near 50, indicating a balanced market.
Trading Plan – Breakout Strategy (Preferred): Given the tightening range, the highest-probability approach is to place pending orders on both sides of the range to catch the breakout. · Buy stop: Set at 1.1717 (above resistance) with a stop-loss at 1.1695 (22 pips risk). · Take-profit 1: 1.1735 → 18 pips profit (0.82:1 R:R). · Take-profit 2: 1.1750 → 33 pips profit (1.5:1 R:R). · Sell stop: Set at 1.1673 (below support) with a stop-loss at 1.1695 (22 pips risk). · Take-profit 1: 1.1655 → 18 pips profit (0.82:1 R:R). · Take-profit 2: 1.1640 → 33 pips profit (1.5:1 R:R). Cancel the unused order once one direction triggers to avoid double exposure.
Trading Plan – Range Strategy (Conservative): If you prefer to avoid false breakouts, trade within the range using limit orders: · Sell limit at 1.1710 with a stop at 1.1725 (15 pips risk) and target 1.1680 (30 pips profit → 2:1 R:R). · Buy limit at 1.1675 with a stop at 1.1660 (15 pips risk) and target 1.1700 (25 pips profit → 1.67:1 R:R). However, given the narrowing range, these levels may not be reached—breakout orders are more likely to trigger.
Risk Management & Timing: The H1 timeframe requires active monitoring. Use limit orders for entries to avoid slippage, especially around psychological levels like 1.1700. With tight stops (15–22 pips), position size can be moderate, but risk no more than 1–2% of account per trade. Be aware of Eurozone/US economic data (ECB minutes, PMIs, NFP) that can cause sudden volatility. Set alerts at 1.1715 (breakout), 1.1675 (breakdown), and 1.1700 (mid-range) to act quickly.
Summary: EUR/USD on the H1 chart is in a tight range between 1.1675 (support) and 1.1715 (resistance), with the current price at 1.1684. The preferred strategy is breakout trading—place a buy stop at 1.1717 targeting 1.1735 and 1.1750, and a sell stop at 1.1673 targeting 1.1655 and 1.1640, each with a 22-pip stop. A conservative approach uses limit orders within the range, but breakout orders are more likely to capture the next move. Given the contracting triangle, this is a moderate-probability setup—trade small, use pending orders, and wait for a confirmed break before committing fully. Patience is essential; the market is coiling for a move.
*The market analysis posted here is meant to increase your awareness, but not to give instructions to make a trade
 Português
 Русский
 English
 Bahasa Indonesia
 Bahasa Malay
 ไทย
ไทย Español
 Deutsch
 Български
 Français
 Tiếng Việt
 中文
中文 বাংলা
বাংলা हिन्दी
 Čeština
 Українська
 Română
