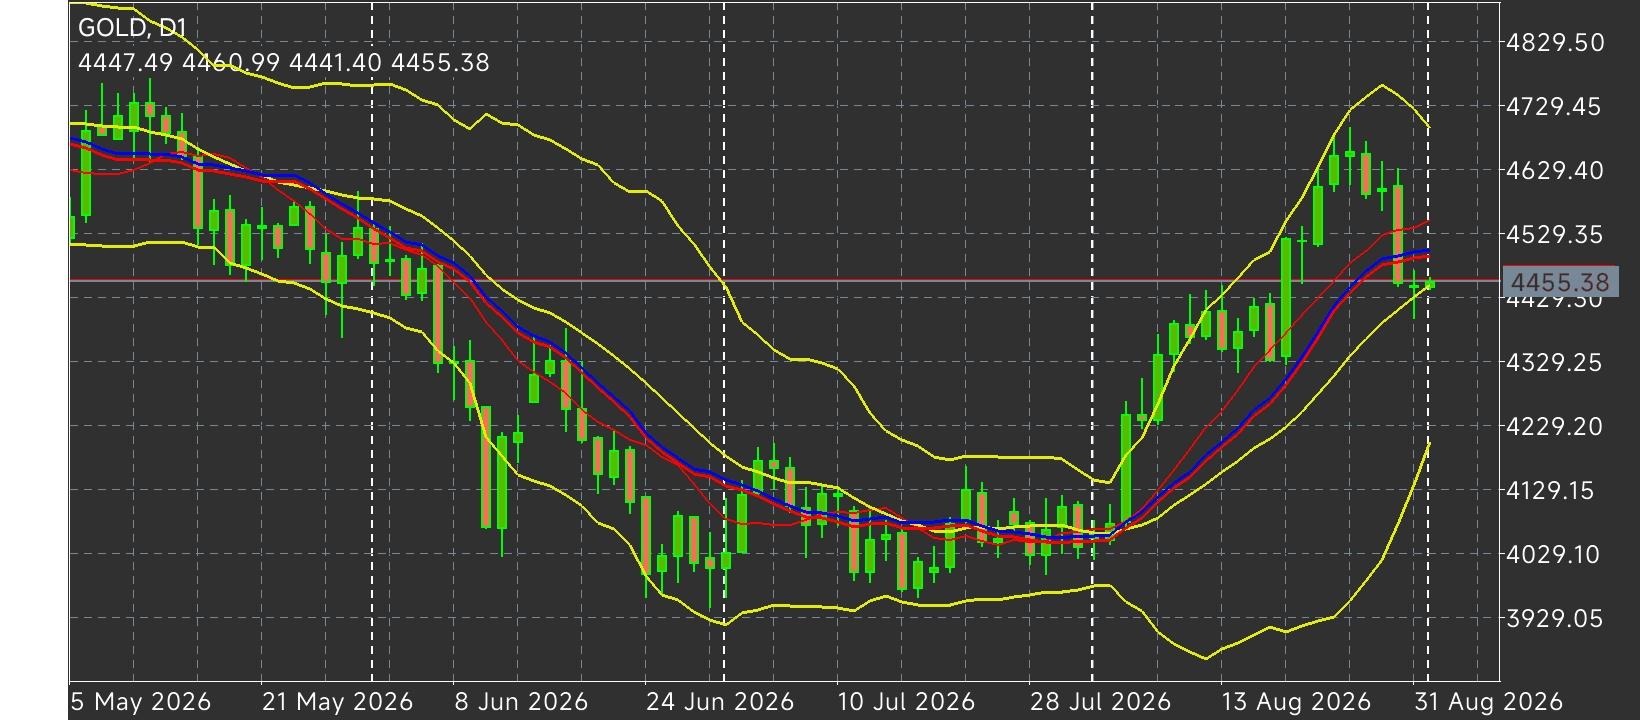
 Hawkish Fed Retaliation and Middle East Escalation Trigger Gold Pullback: Bullion Retests $4,445 Support Zone Gold (XAU/USD)
 experienced upside deceleration during Tuesday's early Asian session, declining toward the
$4,445.00 region as market participants recalibrated monetary policy expectations following Federal Reserve Chair Kevin Warsh’s address at the Jackson Hole Symposium. The sudden shift in tone was amplified by escalating geopolitical friction in the Middle East, where exchange of strikes between U.S. forces and Iranian units—including targets on Larak Island near the Strait of Hormuz—sparked severe oil supply concerns. Energy-driven inflation risks, combined with Chair Warsh’s explicit stance that the 2% PCE inflation target remains "firm and fixed," triggered a sharp hawkish repricing. According to the CME FedWatch Tool, probability metrics for a September interest rate hike surged to 65.4% (up from 39.9% prior to the symposium), propelling Greenback demand and creating short-term structural headwinds for non-yielding bullion. Reflecting this policy shift, FXS Speechtracker quantitative scoring placed Chair Warsh’s hawkish intensity at 7.4—well above the 6.5 historical baseline—while the FXS Fed Sentiment Index hovered at an elevated 129.70. Portfolio managers note that the unexpected strength of the Fed's anti-inflation commitment has forced interim tactical profit-taking across precious metals after settled prices pulled back from recent tests near the
$4,600.00 area. Despite this short-term pressure, gold preserves its broader daily uptrend structure as price continues to trade above its key medium-term moving average and central volatility band.
Hawkish Policy Repricing & Interest Rate Trajectory: Chair Warsh's insistence that monetary conditions are not overly restrictive, alongside rising energy-driven inflation risks, drove September Fed rate-hike odds up to 65.4%, creating near-term headwinds for non-yielding assets.
Geopolitical Risk & Energy Market Friction: Renewed military exchanges near the Strait of Hormuz maintain a underlying safe-haven bid for precious metals, creating a complex fundamental pull between geopolitical risk and hawkish monetary policy.
Indicator Momentum & Oscillators: On the daily timeframe, the Relative Strength Index (RSI) holds at 54.00, keeping momentum in neutral-to-positive territory without entering overbought conditions. From an execution and chart structure perspective, key technical levels and target zones are structured as follows:
Overhead Resistance Targets: Initial resistance is anchored at the recent swing area around
$4,600.00, followed by the upper Bollinger Band boundary at
$4,723.68, where selling pressure is expected to intensify.
Key Support Boundaries: Immediate downside protection is provided by the 20-day Simple Moving Average (SMA) center line at
$4,430.23. A break below this level exposes dynamic structural support at the 100-day Moving Average (
$4,370.48), with the lower Bollinger Band boundary at
$4,136.78 acting as major macro support. The daily technical trend structure for XAU/USD remains constructively bullish while spot prices maintain structural integrity above the
$4,430.23 center line and the
$4,370.48 100-day MA floor.
*The market analysis posted here is meant to increase your awareness, but not to give instructions to make a trade
 Português
 Русский
 English
 Bahasa Indonesia
 Bahasa Malay
 ไทย
ไทย Español
 Deutsch
 Български
 Français
 Tiếng Việt
 中文
中文 বাংলা
বাংলা हिन्दी
 Čeština
 Українська
 Română
