 Market Structure & Multi-Session Price Action
 A technical breakdown of the 15-minute chart for Gold (GOLD.m, M15) in
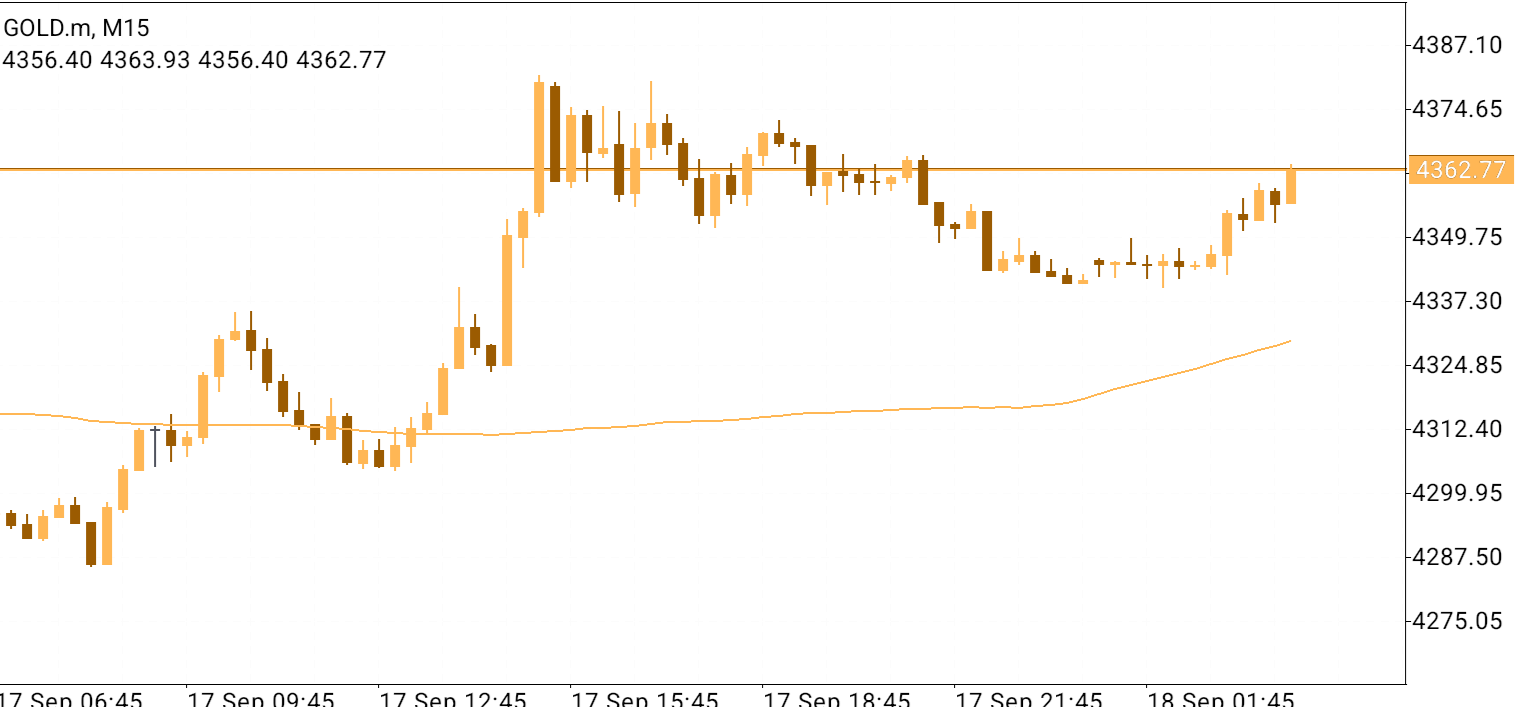
85319.png demonstrates a bullish multi-stage expansion followed by a shallow pullback and steady recovery across September 17 and 18. After breaking out from lower consolidation near 4287.50 on September 17, an aggressive buying surge pushed price action sharply higher to print peak session highs above 4374.65 around 14:00. Profit-taking subsequently triggered a controlled pullback to discount liquidity near 4337.30 during late September 17, where buyers re-entered the market to build a clean higher-low base into September 18.
Critical Levels & Horizontal Pivot Interaction The primary technical reference boundary on this M15 chart is defined by the orange horizontal baseline at
4362.77:
Horizontal Pivot Resistance Baseline (4362.77): This level defines the lower limit of the previous high-volume distribution block from September 17, acting as an active structural resistance barrier.
Current Intraday Price Compression: The latest 15-minute candle (OHLC: 4356.40 open, 4363.93 high, 4356.40 low, 4362.77 close) shows price action accelerating upward to test this key horizontal baseline. Closing right on
4362.77 after reaching a high of 4363.93, the market reflects an active breakout test against overhead supply.
Dynamic Trend & Momentum Integration Integrating the technical indicators in
85319.png, the dynamic moving average confirms an established macro bullish trend across the M15 timeframe. The moving average trends steadily upward from 4312.40 on September 17, trailing beneath price action near
4324.85–4330.00 on September 18. Maintaining a position well above this ascending dynamic boundary keeps overall trend structure firmly aligned in favor of buyers.
Forward Trading Scenarios & M15 Outlook As Gold tests the
4362.77 horizontal resistance baseline, short-term traders should track two primary technical scenarios:
Technical Summary: The GOLD.m M15 chart in
85319.png demonstrates price retesting a key horizontal resistance baseline at
4362.77 following a higher-low rebound from 4337.30. Supported by an ascending 15-minute moving average near 4330.00, broader trend structure remains firmly bullish. A decisive M15 close above 4363.93 enables buyers to target resistance at 4374.65 and 4387.10, whereas a closing rejection below 4356.40 risks a pullback toward support at 4349.75 and 4337.30.
Bullish Breakout & High-Retest Continuation: A confirmed M15 candle hold and close above
4363.93 will signal a successful breakout from recent lower-high consolidation. Securing a hold above this level enables buyers to re-ignite bullish expansion toward overhead resistance targets at 4374.65 and multi-session peak highs near 4387.10.
Bearish Rejection & Downside Pullback: Conversely, if sellers defend
4362.77 and force an M15 close beneath
4356.40, short-term momentum will stall. A closing break below 4356.40 will likely trigger a corrective retracement toward support targets at 4349.75 and 4337.30, with primary trend defense held along the ascending moving average near 4330.00.
*The market analysis posted here is meant to increase your awareness, but not to give instructions to make a trade
 Português
 Русский
 English
 Bahasa Indonesia
 Bahasa Malay
 ไทย
ไทย Español
 Deutsch
 Български
 Français
 Tiếng Việt
 中文
中文 বাংলা
বাংলা हिन्दी
 Čeština
 Українська
 Română
