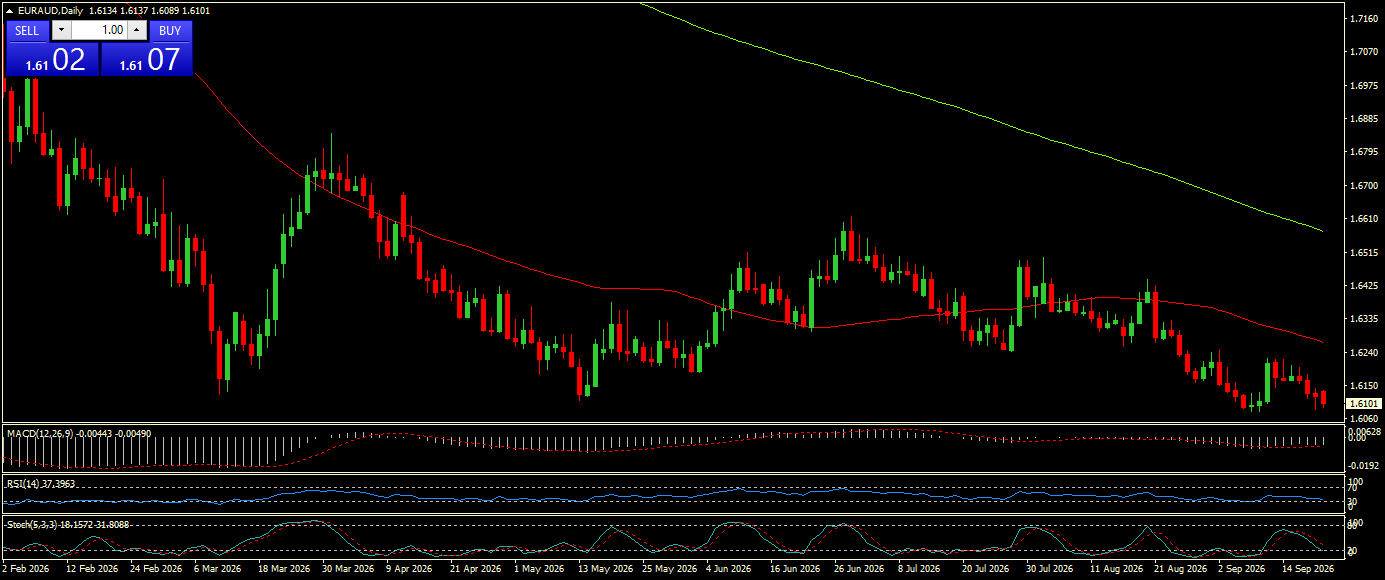
 Daily EUR/AUD Technical Outlook:
 Taking a comprehensive look at the EUR/AUD daily chart today, the overall market structure continues to exhibit a steady downward trajectory following multiple failed recovery attempts below the key moving averages. Price has been grinding lower along a well-defined bearish trend, staying firmly suppressed beneath the red faster Simple Moving Average (SMA), while the longer-term green SMA trends much higher around the 1.6600 region, acting as a massive macro overhead dynamic resistance line. Looking closely at recent candlestick action, the pair recently printed a local low near 1.6060 before experiencing a weak bounce that stalled around 1.6240, where the red SMA provided instant resistance and pushed price right back down to current levels around 1.6101. Momentum indicators across the bottom of the chart strongly support this prevailing bearish momentum; the Relative Strength Index (RSI) is holding low near 37.39 without reaching severe oversold conditions, while both the MACD histogram and Stochastic oscillator are sloping downward following recent bearish crossovers. From where I stand, as long as price remains trapped beneath the red SMA dynamic barrier, the immediate path of least resistance continues to favor further downside pressure toward major historical floors. When evaluating potential trade setups for this pair, I am closely watching the primary demand and buy zone situated between the 1.6000 psychological support level and 1.6060. If price drops into this critical support region and begins to show clear signs of exhaustion with long lower rejection wicks or bullish reversal daily candles, I would consider looking for a long positioning attempt targeting an initial take-profit objective near 1.6240, with a secondary extended upside target reaching toward the 1.6425 resistance area. To protect trading capital against extended losses, a strict protective stop loss should be placed safely below the critical support handle around 1.5950. Conversely, if sellers manage to maintain their dominant posture and force a decisive daily candle close beneath the 1.6000 boundary, it would completely invalidate any bullish reversal scenario and open the door for a deeper leg down toward the 1.5880 support region. Given that the overall primary trend remains heavily tilted to the downside, I prefer to remain patient and wait for price action to offer a clear, high-probability reaction inside our buy zone before committing any fresh positions.
*The market analysis posted here is meant to increase your awareness, but not to give instructions to make a trade
 Português
 Русский
 English
 Bahasa Indonesia
 Bahasa Malay
 ไทย
ไทย Español
 Deutsch
 Български
 Français
 Tiếng Việt
 中文
中文 বাংলা
বাংলা हिन्दी
 Čeština
 Українська
 Română
