 EUR/USD H1 TIMEFRAME TECHNICAL ANALYSIS Price Action and Trend Analysis
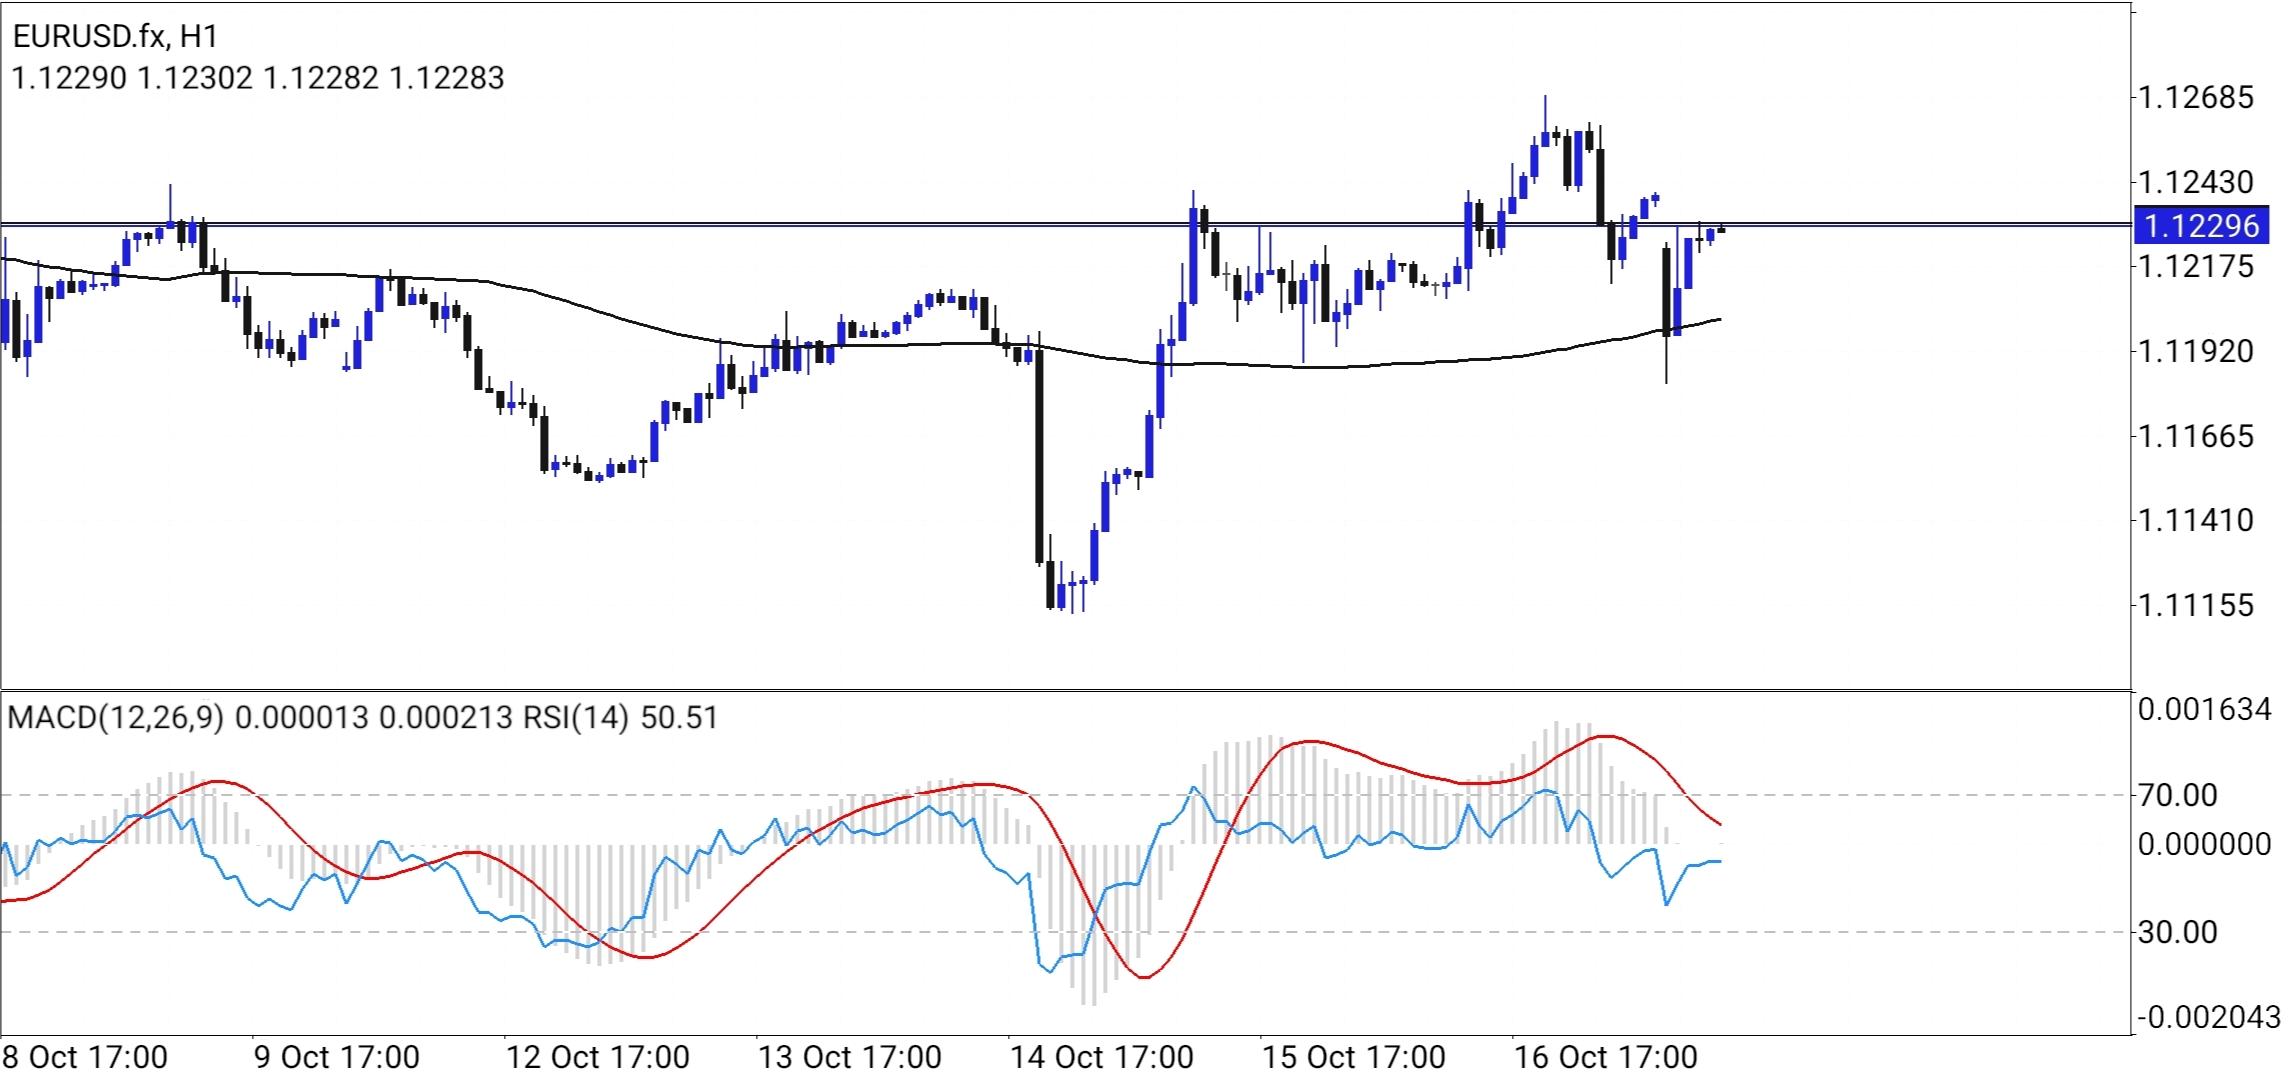
The EURUSD pair is currently trading around the 1.12296 level. The broader hourly trend since the sharp sell-off on October 14th has been bullish, characterized by a series of higher highs and higher lows. However, the immediate price action suggests a consolidation phase or a potential pullback. The price recently spiked to a local high near 1.12685 before encountering significant selling pressure. This rejection created a bearish engulfing pattern followed by a sharp decline. Currently, the price is hovering just below a key horizontal resistance zone established around 1.1230 – 1.1240. This area has acted as both previous support and current resistance. A decisive break above 1.1240 is required to resume the uptrend toward the recent highs. Conversely, failure to hold current levels could see the price retest the moving average support band around 1.1190 – 1.1200.
Moving Averages The black line (likely a longer-term Simple Moving Average, such as the 50 or 100 SMA) is flattening out and acting as dynamic support. The price is currently trading slightly above this average, which confirms that the medium-term bias remains neutral-to-bullish. As long as the price stays above this curved baseline, the bulls retain control of the broader structure.
Indicator Analysis (MACD & RSI) • RSI (Relative Strength Index): The RSI(14) is reading at 50.51. This is a critical neutral reading. It indicates that the market is currently undecided. The RSI has dropped from overbought territory (>70) during the recent peak and is now testing the midpoint. A break below 50 would signal increasing bearish momentum, while a bounce from here would suggest the bulls are stepping back in. • MACD (Moving Average Convergence Divergence): The MACD histogram shows shrinking bars, and the signal lines are converging near the zero line. The fast line (blue) is slightly below the signal line (red), indicating weak bearish momentum in the very short term. However, because this crossover is happening near the zero line rather than deep in negative territory, it suggests a lack of strong directional conviction rather than a confirmed crash.
Conclusion and Outlook The EURUSD H1 chart depicts a market in equilibrium following a volatile recovery. The pair is sandwiched between immediate resistance at 1.1240 and dynamic support near 1.1200. • Bullish Scenario: Traders should look for a sustained candle close above 1.1240. This would invalidate the current pullback and target the 1.1268 high. • Bearish Scenario: If the price breaks below the 1.1217 local low, expect a deeper correction toward the 1.1192 moving average support. Given the RSI at exactly 50, patience is advised until a clear breakout from this narrow range occurs.
*The market analysis posted here is meant to increase your awareness, but not to give instructions to make a trade
 Português

 Русский
 English
 Bahasa Indonesia
 Bahasa Malay
 ไทย
 Español
 Deutsch
 Български
 Français
 Tiếng Việt
 中文
 বাংলা
 हिन्दी
 Čeština
 Українська
 Română

