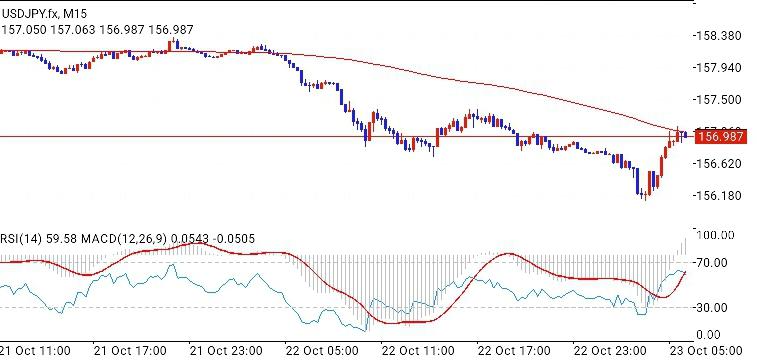
 USD/JPY M15 Technical Outlook (Oct 23, 2026 ) Price action:
USD/JPY is trading near 156.99 after a sharp V-shaped recovery from the session low around 156.18. The pair spent most of Oct 22 in a steady decline from the 158.30 area, shedding roughly 200 pips before buyers stepped in during the late Asian session. The bounce has been impulsive, with a run of strong bullish candles lifting price back to the 157.00 zone.
Key levels: Immediate resistance sits at 157.00 to 157.10, where the horizontal line and the long red moving average converge. This is the decisive barrier. Above it, the next targets are 157.50 and then the 157.94 to 158.00 area, which capped price earlier in the decline. Support is 156.62 first, then the 156.18 low. A break below that low would reopen the downtrend toward 155.80.
Moving average: The sloping red line (likely a long-period MA) has acted as dynamic resistance throughout the sell-off, rejecting every rally since late on Oct 21. Price is now testing it from below for the first time since the breakdown. A clean M15 close above it would be the first real sign of a trend shift; failure here would keep the broader bias bearish.
Momentum: RSI(14) reads 59.58, having climbed from deeply oversold territory near 30 and now approaching the 70 line. This confirms strong short-term buying pressure but also leaves limited room before overbought conditions. MACD (12,26,9) shows the line at 0.0543 against a signal of -0.0505, with the histogram turning positive. The bullish crossover supports the rebound, though the readings are still near zero, so conviction is modest.
Scenarios: Bullish: A sustained M15 close above 157.10 with RSI holding above 55 targets 157.50, then 157.94. Pullbacks toward 156.62 would be buying opportunities. Bearish: Rejection at 157.00 to 157.10, especially with RSI rolling over from the 65 to 70 zone, suggests the bounce was corrective. A move back under 156.62 would target a retest of 156.18.
Bias: Neutral to cautiously bullish in the very short term, but the prevailing M15 structure remains lower highs and lower lows until the moving average is reclaimed. Traders should wait for confirmation at the 157.00 to 157.10 resistance rather than chase the rally, keeping stops beyond 156.62 for longs or above 157.50 for shorts.
Note: This is technical analysis based on the chart provided, not financial advice. Watch for scheduled US data and BoJ commentary, which can move this pair sharply.
*The market analysis posted here is meant to increase your awareness, but not to give instructions to make a trade
 Português

 Русский
 English
 Bahasa Indonesia
 Bahasa Malay
 ไทย
 Español
 Deutsch
 Български
 Français
 Tiếng Việt
 中文
 বাংলা
 हिन्दी
 Čeština
 Українська
 Română

