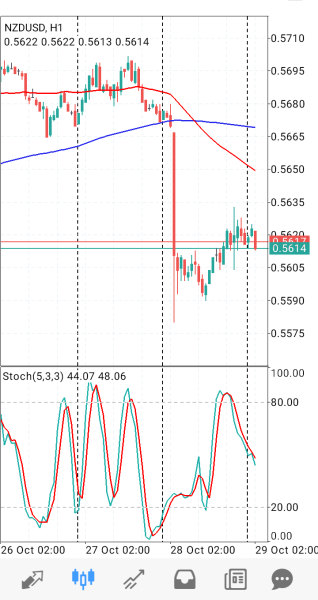
Based on the NZD/USD H1 chart, the current price is around 0.5614. Market conditions show a bearish bias after a sharp decline from the 0.5660 area down to 0.5600. Price is now consolidating after that drop, so traders need to be cautious before taking positions. The main strategy is to look for SELL opportunities following the downtrend. The red moving average line appears to be declining and is above the price, indicating selling pressure is still dominant. The blue moving average line is also above the current price, so any price increase is still likely to be a temporary correction. However, avoid opening sell positions hastily because the price is moving sideways around 0.5610–0.5620. The nearest resistance area is at 0.5620–0.5625. If the price rises to that area and then forms a strong bearish candlestick, traders can consider SELL after confirmation appears. Stop loss can be placed above 0.5630, adjusted for volatility and risk size. The first take profit target is at 0.5600, while the next targets are around 0.5590 and 0.5580 if selling pressure continues. The Stochastic indicator (5,3,3) shows values around 44 and 48, with both lines starting to decline from the overbought area. This condition supports potential price weakness, but it is not yet enough to be a sell signal without candlestick movement confirmation. An alternative scenario is BUY only if the price can break through the 0.5625 resistance and hold above it, accompanied by clear bullish momentum. If the price remains trading between support 0.5600 and resistance 0.5625, it is better to wait than to force a trade. Limit the risk of each position to a maximum of 1% of capital and ensure a minimum risk-to-reward ratio of 1:2. Remember, technical analysis does not guarantee results; always use a stop loss and avoid entry when signals are not yet confirmed.
*The market analysis posted here is meant to increase your awareness, but not to give instructions to make a trade
 Português

 Русский
 English
 Bahasa Indonesia
 Bahasa Malay
 ไทย
 Español
 Deutsch
 Български
 Français
 Tiếng Việt
 中文
 বাংলা
 हिन्दी
 Čeština
 Українська
 Română

