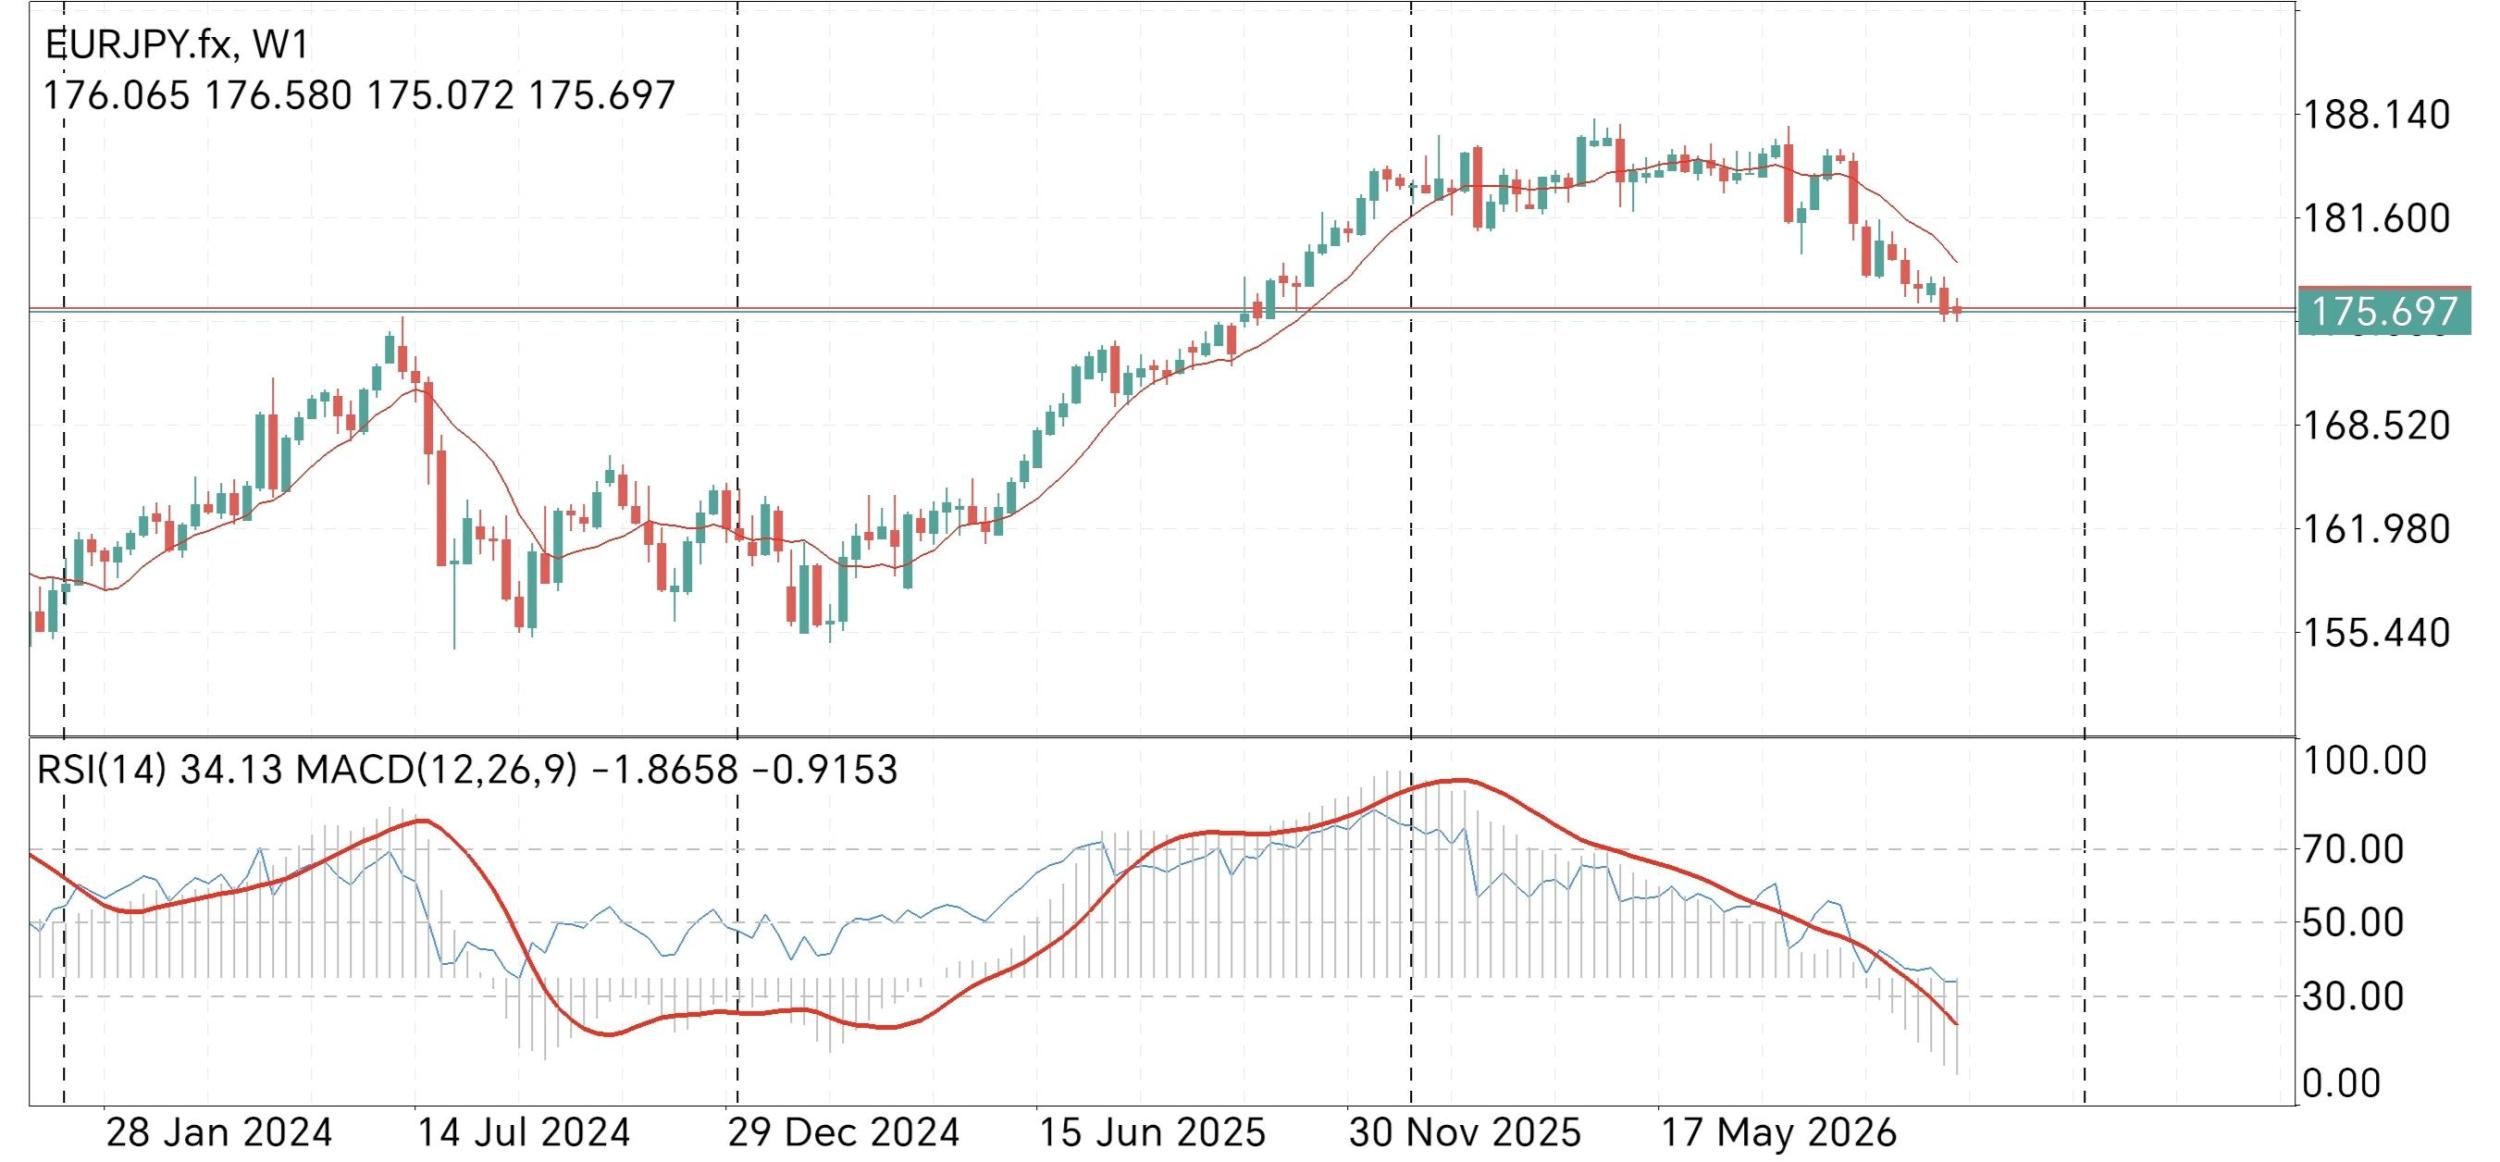
This weekly chart of EURJPY presents a textbook example of a macro trend transition following an extended impulsive phase. According to classical Dow Theory, the primary trend from mid-2024 through late 2025 was decisively bullish, characterized by a sequence of higher highs and higher lows. However, the current market structure has shifted into a corrective phase, forming a distinct distribution pattern at the highs. The visible price action reveals a potential complex topping formation—resembling a head-and-shoulders or a rounded double-top structure—centered around the 188.000 psychological resistance level. The price has recently broken below the neckline of this consolidation, marked by the steep red candle that pierces the 175.697 support zone, confirming a bearish shift in the medium-term momentum. The technical indicators on the lower pane strongly corroborate this bearish market structure. The RSI (14) is currently reading at 34.13, descending sharply toward oversold territory but lacking the bullish divergence often seen at major bottoms. Meanwhile, the MACD (12, 26, 9) has executed a bearish crossover, with the signal lines diving below the zero line and the histogram printing deep negative values (-1.8658), indicating accelerating selling pressure. The nearest major support is the current price level of 175.697, which aligns with the late-2024 swing highs and the recent breakdown point. If this level fails to hold on a weekly closing basis, the next major structural support sits near the 162.000 region (the late-2024 swing lows). Immediate resistance has now formed at the 181.600 level, where the price previously consolidated before the breakdown. Based on this technical framework, two scenarios are highly probable. The Bearish Scenario (Primary): The pair continues its descent from the 175.697 breakdown, targeting the 168.520 intermediate support and eventually the 162.000 major support zone. A retest of the 181.600 resistance that fails to break higher would offer a prime short-entry signal, aligning with the MACD's negative divergence and the RSI's downward trajectory. The Bullish Scenario (Counter-Trend): If the 175.697 level acts as a robust floor and the RSI quickly bounces from the 30 oversold threshold, a corrective rally could ensue. A bullish reversal would require a weekly close above 181.600 to invalidate the bearish structure and suggest a retest of the 188.000 highs, though this seems less likely given the heavy momentum of the current sell-off.
Trade Setup Summary: The bias is currently Bearish for the medium term. Traders should look to sell rallies toward the 178.000–181.600 resistance zone, setting a stop-loss above the 184.000 swing high to protect against a false breakdown. The primary take-profit target is set at 168.520, with a secondary target at 162.000. Alternatively, aggressive traders can enter short at the current market price (175.697) with a wider stop, but given the RSI's proximity to oversold territory, patience for a mean-reversion pullback is prudent to maximize the risk-to-reward ratio.
*The market analysis posted here is meant to increase your awareness, but not to give instructions to make a trade
 Português

 Русский
 English
 Bahasa Indonesia
 Bahasa Malay
 ไทย
 Español
 Deutsch
 Български
 Français
 Tiếng Việt
 中文
 বাংলা
 हिन्दी
 Čeština
 Українська
 Română

