 Română
  Русский
 English
 Bahasa Indonesia
 Bahasa Malay
 ไทย
ไทย Español
 Deutsch
 Български
 Français
 Tiếng Việt
 中文
中文 বাংলা
বাংলা हिन्दी
 Čeština
 Українська
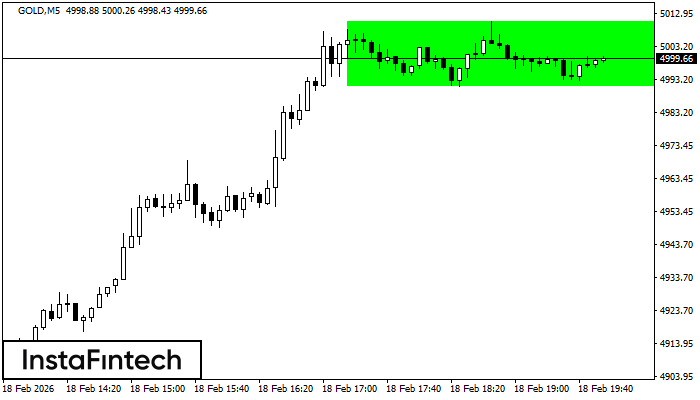 According to the chart of M5, GOLD formed the Bullish Rectangle. The pattern indicates a trend continuation. The upper border is 5010.57, the lower border is 4991.00. The signal means that a long position should be opened above the upper border 5010.57 of the Bullish Rectangle.
 The M5 and M15 time frames may have more false entry points.