 Română
  Русский
 English
 Bahasa Indonesia
 Bahasa Malay
 ไทย
ไทย Español
 Deutsch
 Български
 Français
 Tiếng Việt
 中文
中文 বাংলা
বাংলা हिन्दी
 Čeština
 Українська
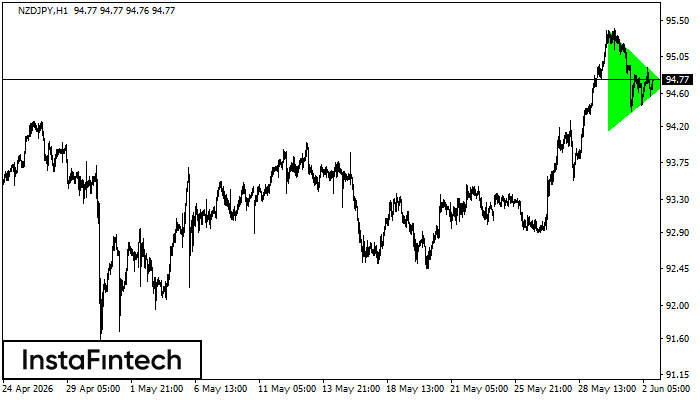 According to the chart of H1, NZDJPY formed the Bullish Symmetrical Triangle pattern. Description: This is the pattern of a trend continuation. 95.38 and 94.15 are the coordinates of the upper and lower borders respectively. The pattern width is measured on the chart at 123 pips. Outlook: If the upper border 95.38 is broken, the price is likely to continue its move by 95.11.
 FX.co ★ NZDJPY H1: Bullish Symmetrical Triangle
Signal strength 4 of 5
NZDJPY H1: Bullish Symmetrical Triangle
According to the chart of H1, NZDJPY formed the Bullish Symmetrical Triangle pattern. Description: This is the pattern of a trend continuation. 95.38 and 94.15 are the coordinates of the upper and lower borders respectively. The pattern width is measured on the chart at 123 pips. Outlook: If the upper border 95.38 is broken, the price is likely to continue its move by 95.11. *The market analysis posted here is meant to increase your awareness, but not to give instructions to make a trade