 Română
  Русский
 English
 Bahasa Indonesia
 Bahasa Malay
 ไทย
ไทย Español
 Deutsch
 Български
 Français
 Tiếng Việt
 中文
中文 বাংলা
বাংলা हिन्दी
 Čeština
 Українська
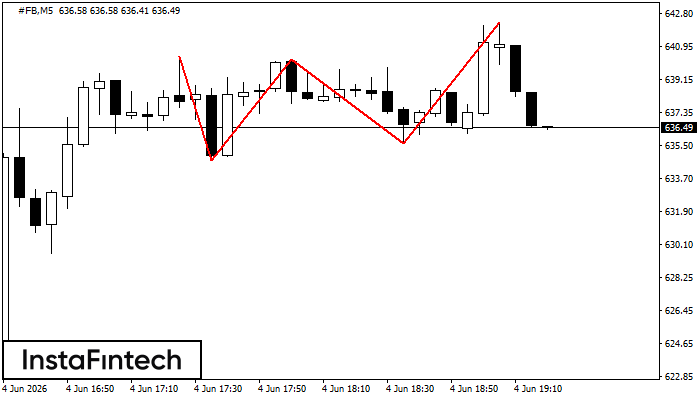 The Triple Top pattern has formed on the chart of the #FB M5. Features of the pattern: borders have an ascending angle; the lower line of the pattern has the coordinates 634.71/635.61 with the upper limit 640.39/642.27; the projection of the width is 568 points. The formation of the Triple Top figure most likely indicates a change in the trend from upward to downward. This means that in the event of a breakdown of the support level of 634.71, the price is most likely to continue the downward movement.
 The M5 and M15 time frames may have more false entry points.