 Română
 Русский
 English
 Bahasa Indonesia
 Bahasa Malay
 ไทย
ไทย Español
 Deutsch
 Български
 Français
 Tiếng Việt
 中文
中文 বাংলা
বাংলা हिन्दी
 Čeština
 Українська

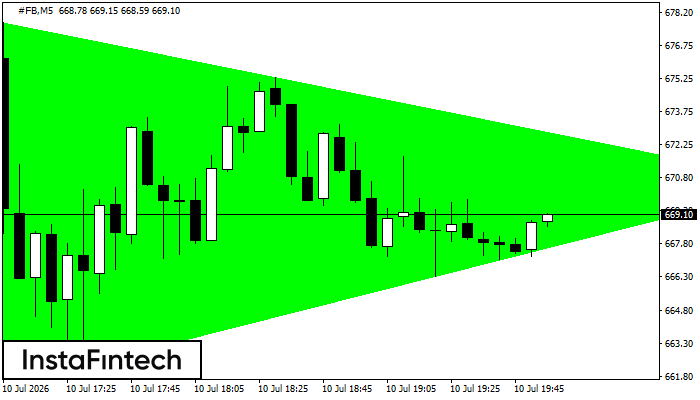 According to the chart of M5, #FB formed the Bullish Symmetrical Triangle pattern. The lower border of the pattern touches the coordinates 661.37/670.53 whereas the upper border goes across 677.78/670.53. If the Bullish Symmetrical Triangle pattern is in progress, this evidently signals a further upward trend. In other words, in case the scenario comes true, the price of #FB will breach the upper border to head for 670.68.
 The M5 and M15 time frames may have more false entry points.