 Română
 Русский
 English
 Bahasa Indonesia
 Bahasa Malay
 ไทย
ไทย Español
 Deutsch
 Български
 Français
 Tiếng Việt
 中文
中文 বাংলা
বাংলা हिन्दी
 Čeština
 Українська

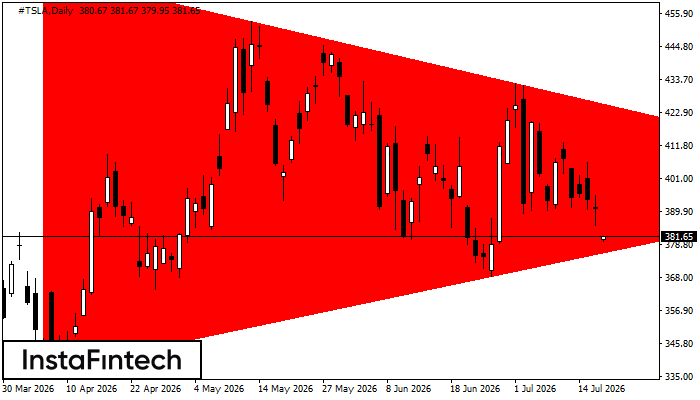 According to the chart of D1, #TSLA formed the Bearish Symmetrical Triangle pattern. Description: The lower border is 337.01/399.66 and upper border is 469.33/399.66. The pattern width is measured on the chart at -13232 pips. The formation of the Bearish Symmetrical Triangle pattern evidently signals a continuation of the downward trend. In other words, if the scenario comes true and #TSLA breaches the lower border, the price could continue its move toward 399.26.
 FX.co ★ #TSLA D1: Bearish Symmetrical Triangle
Signal strength 5 of 5
#TSLA D1: Bearish Symmetrical Triangle
According to the chart of D1, #TSLA formed the Bearish Symmetrical Triangle pattern. Description: The lower border is 337.01/399.66 and upper border is 469.33/399.66. The pattern width is measured on the chart at -13232 pips. The formation of the Bearish Symmetrical Triangle pattern evidently signals a continuation of the downward trend. In other words, if the scenario comes true and #TSLA breaches the lower border, the price could continue its move toward 399.26. *The market analysis posted here is meant to increase your awareness, but not to give instructions to make a trade