 Română
 Русский
 English
 Bahasa Indonesia
 Bahasa Malay
 ไทย
ไทย Español
 Deutsch
 Български
 Français
 Tiếng Việt
 中文
中文 বাংলা
বাংলা हिन्दी
 Čeština
 Українська

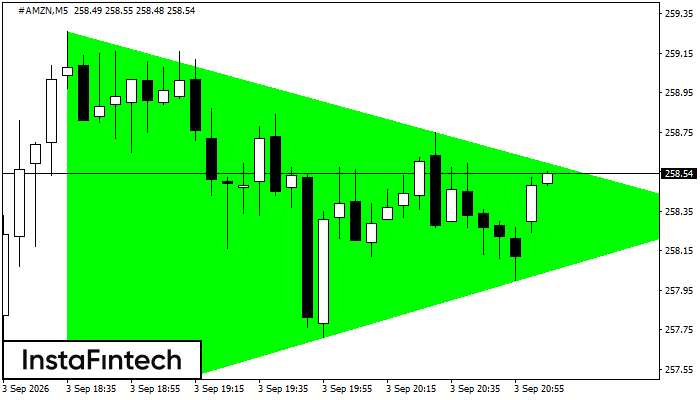 The Bullish Symmetrical Triangle pattern has formed on the #AMZN M5 chart. This is a trend continuation pattern. Its upper and lower boundaries are at 259.26 and 257.32, respectively. The pattern width is 194 points. If the price breaks above the upper boundary at 259.26, it is likely to move toward 258.48.
 The M5 and M15 time frames may generate more false entry signals.