 Română
 Русский
 English
 Bahasa Indonesia
 Bahasa Malay
 ไทย
ไทย Español
 Deutsch
 Български
 Français
 Tiếng Việt
 中文
中文 বাংলা
বাংলা हिन्दी
 Čeština
 Українська

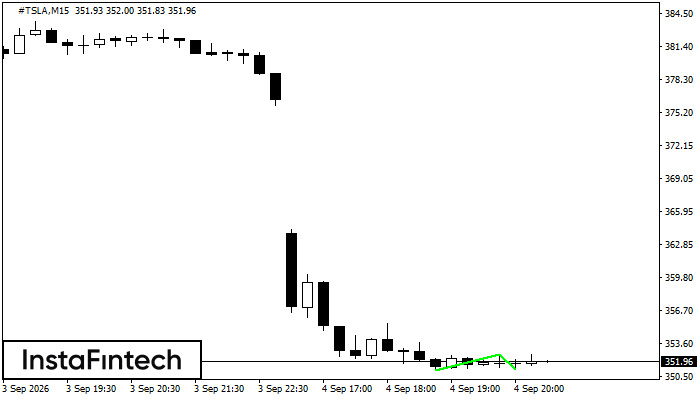 The Double Bottom pattern has formed on the #TSLA M15 chart. Its upper boundary is at 352.57, its lower boundary is at 351.19, and its width is 145 points. A break above the upper boundary at 352.57 may confirm a trend reversal, with the pattern width defining the projected distance to a potential Take Profit level.
 The M5 and M15 time frames may generate more false entry signals.