 Română
 Русский
 English
 Bahasa Indonesia
 Bahasa Malay
 ไทย
ไทย Español
 Deutsch
 Български
 Français
 Tiếng Việt
 中文
中文 বাংলা
বাংলা हिन्दी
 Čeština
 Українська
FX.co ★ Actual patterns. Technical analysis and trading recommendations

Technical Analysis Patterns
There is nothing more precious to a trader than an ability to predict a further price movement. Technical analysis is a key to your successful transaction. At the same time, you can rely on common and recurring situations that arise in the same circumstances. Our Technical Analysis Patterns section features all trading recommendations based on the technical analysis patterns that help traders make projections and turn a profit.
Instrument:
1 selected
#Bitcoin
EURCHF
EURGBP
EURJPY
EURUSD
EURCAD
EURRUB
EURNZD
USDCAD
USDCHF
USDJPY
USDRUB
NZDCAD
NZDUSD
NZDCHF
NZDJPY
AUDCAD
AUDCHF
AUDJPY
AUDUSD
GBPUSD
GBPJPY
GBPAUD
GBPCHF
GOLD
SILVER
#AAPL
#AMZN
#EBAY
#FB
#GOOG
#MCD
#MA
#KO
#INTC
#MSFT
#NTDOY
#PEP
#TSLA
#TWTR
Figure:
All
Triangle
Rectangle
Pennant
Flag
Head and Shoulders
Double Top
Triple Top
Timeframe:
All
M5
M15
M30
H1
D1
Signal strength:
All
High
Medium
Low
Signal direction:
All
Buy
Sell
#PEP
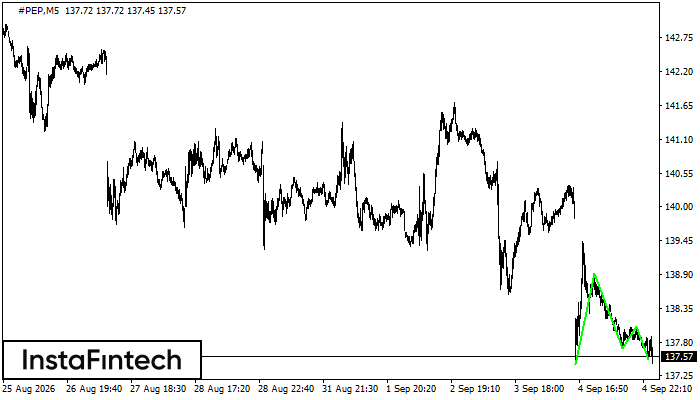
#PEP M5
Triple Bottom
The Triple Bottom pattern has formed on the #PEP M5 chart. A break above the confirmation resistance at 138.92 may signal a reversal from a downtrend to an uptrend.
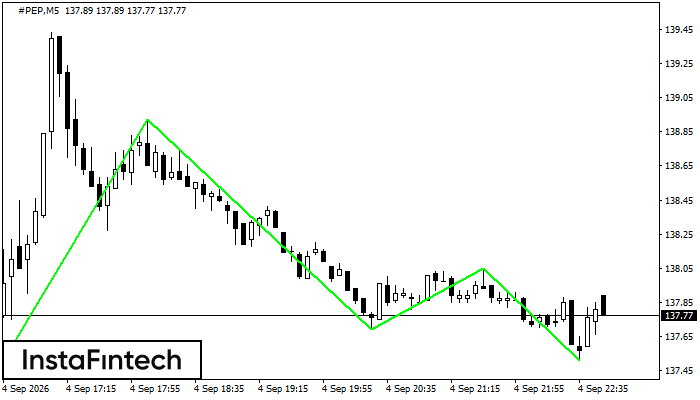
#PEP M5
Triple Bottom
The Triple Bottom pattern has formed on the chart of #PEP M5. The lower boundary is at 137.51, while the upper boundary is at 138.92/138.05. The projected width is 123 points. The formation of the Triple Bottom pattern most likely indicates a change from a downward to an upward trend. If the confirmation resistance at 138.92 is broken, the price is likely to continue upward.
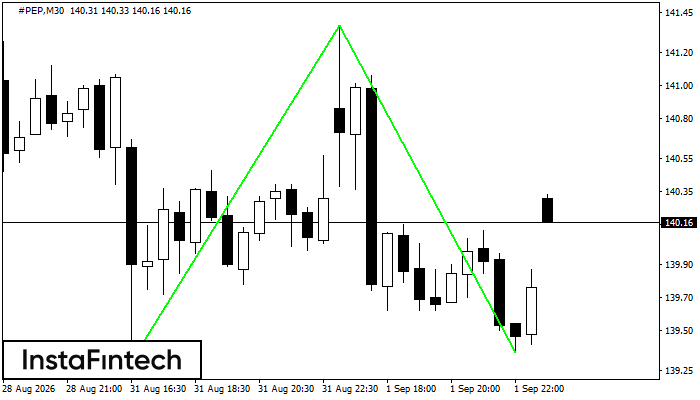
#PEP M30
Double Bottom
The Double Bottom pattern has formed on the #PEP M30 chart. Its upper boundary is at 141.37, its lower boundary is at 139.36, and its width is 206 points. A break above the upper boundary at 141.37 may confirm a trend reversal, with the pattern width defining the projected distance to a potential Take Profit level.
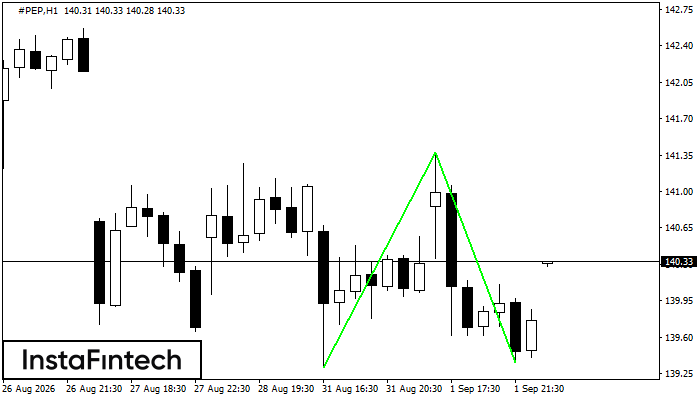
#PEP H1
Double Bottom
The Double Bottom pattern has formed on the #PEP H1 chart and signals a potential reversal from a downtrend to an uptrend. A long position may be considered after the price breaks above the upper boundary at 141.37. The projected move is based on the pattern width of 206 points.
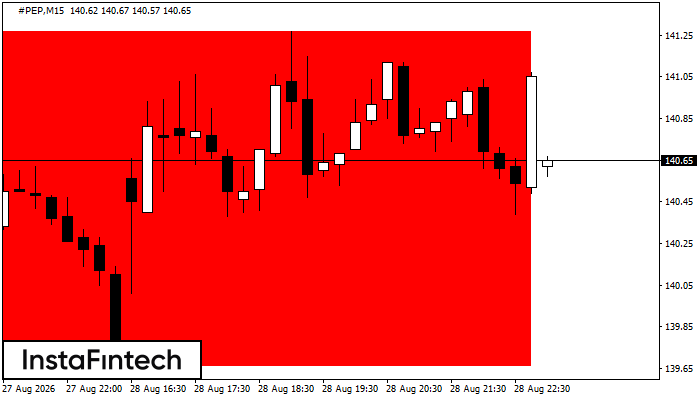
#PEP M15
Bearish Rectangle
The Bearish Rectangle has formed on the #PEP M15 chart and indicates a likely continuation of the trend. Its upper boundary is at 141.27 and its lower boundary is at 139.66. A short position may be considered once the price closes below the lower boundary at 139.66 of the Bearish Rectangle.
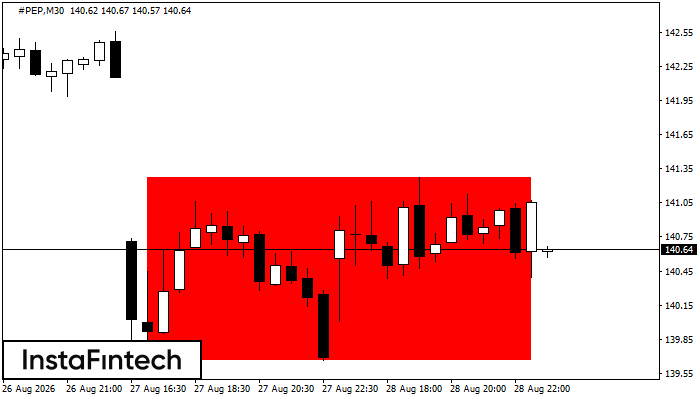
#PEP M30
Bearish Rectangle
The Bearish Rectangle has formed on the #PEP M30 chart. This is a trend continuation pattern bounded by the lower boundary at 139.66–139.66 and the upper boundary at 141.27–141.27. A breakout below the lower boundary is likely to signal a continuation of the downtrend.
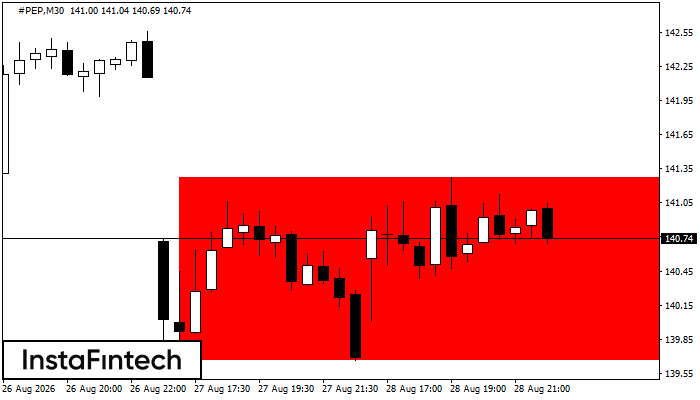
#PEP M30
Bearish Rectangle
The Bearish Rectangle has formed on the #PEP M30 chart and indicates a likely continuation of the trend. Its upper boundary is at 141.27 and its lower boundary is at 139.66. A short position may be considered once the price closes below the lower boundary at 139.66 of the Bearish Rectangle.
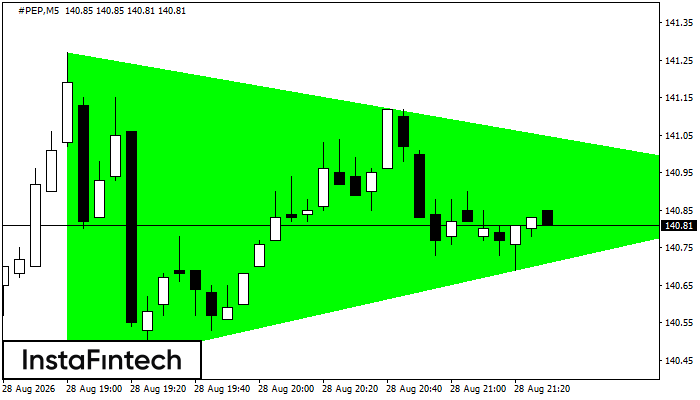
#PEP M5
Bullish Symmetrical Triangle
The Bullish Symmetrical Triangle pattern has formed on the #PEP M5 chart. Its lower boundary passes through 140.42/140.90, while its upper boundary passes through 141.27/140.90. The Bullish Symmetrical Triangle is a continuation pattern and therefore supports a further rise. If confirmed, #PEP is expected to break the upper boundary and move toward 141.05.
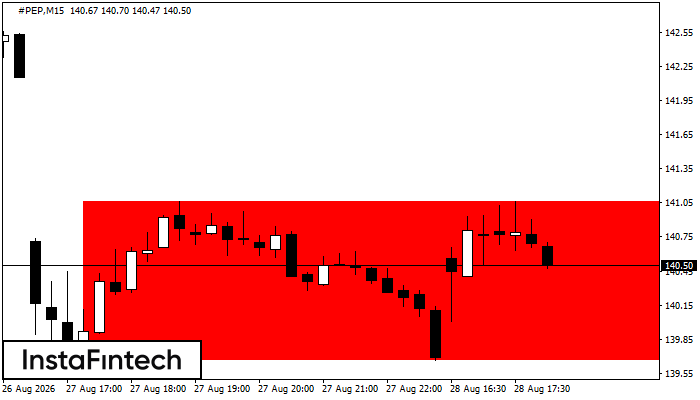
#PEP M15
Bearish Rectangle
The Bearish Rectangle has formed on the #PEP M15 chart and indicates a likely continuation of the trend. Its upper boundary is at 141.06 and its lower boundary is at 139.66. A short position may be considered once the price closes below the lower boundary at 139.66 of the Bearish Rectangle.
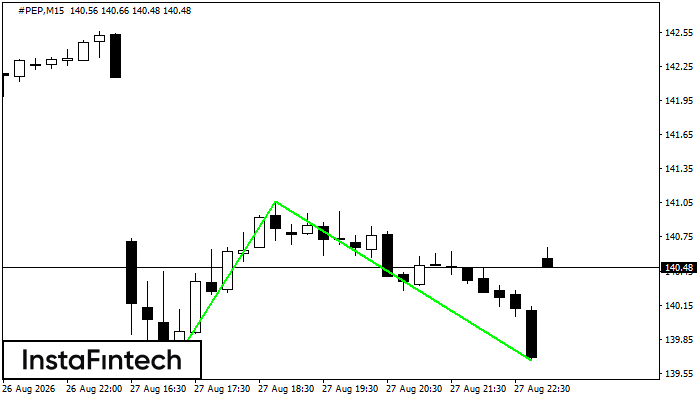
#PEP M15
Double Bottom
The Double Bottom pattern has formed on the #PEP M15 chart. Its support is at 139.72, its resistance is at 141.06, and its width is 134 points. A break above resistance may confirm a trend reversal, with the first target projected 140 points away.