 English
  Русский
 Bahasa Indonesia
 Bahasa Malay
 ไทย
ไทย Español
 Deutsch
 Български
 Français
 Tiếng Việt
 中文
中文 বাংলা
বাংলা हिन्दी
 Čeština
 Українська
 Română
FX.co ★ Patterns AUDCHF | Australian Dollar (AUD) to Swiss Franc (CHF) Rate in the Forex market

AUDCHF M5
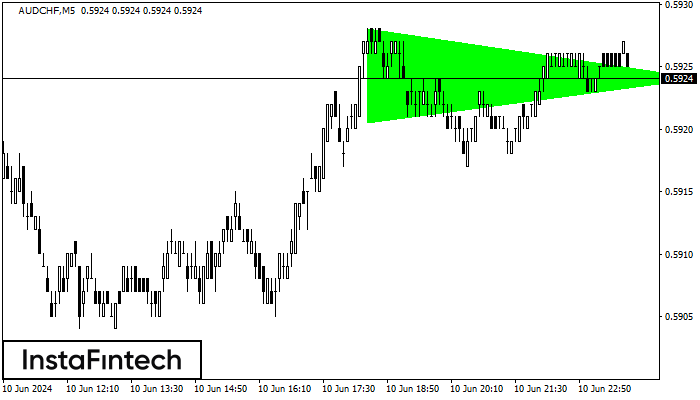
Bullish Symmetrical Triangle
According to the chart of M5, AUDCHF formed the Bullish Symmetrical Triangle pattern. Description: This is the pattern of a trend continuation. 0.5928 and 0.5921 are the coordinates of the upper and lower borders respectively. The pattern width is measured on the chart at 7 pips. Outlook: If the upper border 0.5928 is broken, the price is likely to continue its move by 0.5939.
AUDCHF M5
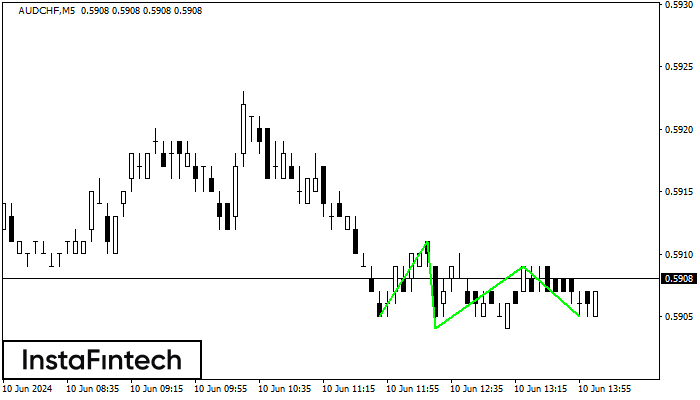
Triple Bottom
The Triple Bottom pattern has formed on the chart of the AUDCHF M5 trading instrument. The pattern signals a change in the trend from downwards to upwards in the case of breakdown of 0.5911/0.5909.
AUDCHF M5
Double Bottom
The Double Bottom pattern has been formed on AUDCHF M5; the upper boundary is 0.5924; the lower boundary is 0.5914. The width of the pattern is 11 points. In case of a break of the upper boundary 0.5924, a change in the trend can be predicted where the width of the pattern will coincide with the distance to a possible take profit level.
AUDCHF M5
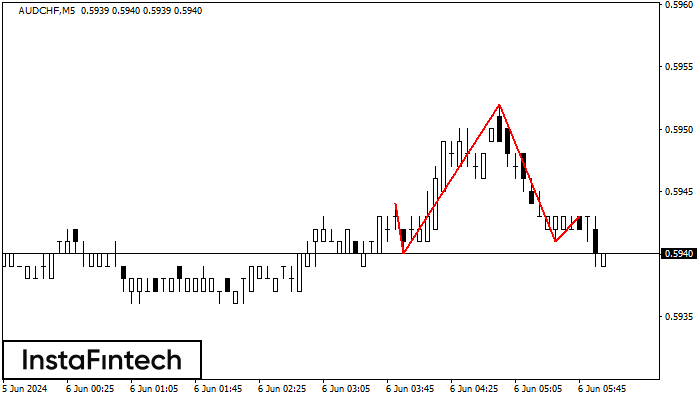
Head and Shoulders
The technical pattern called Head and Shoulders has appeared on the chart of AUDCHF M5. There are weighty reasons to suggest that the price will surpass the Neckline 0.5940/0.5941 after the right shoulder has been formed. So, the trend is set to change with the price heading for 0.5926.
AUDCHF M5
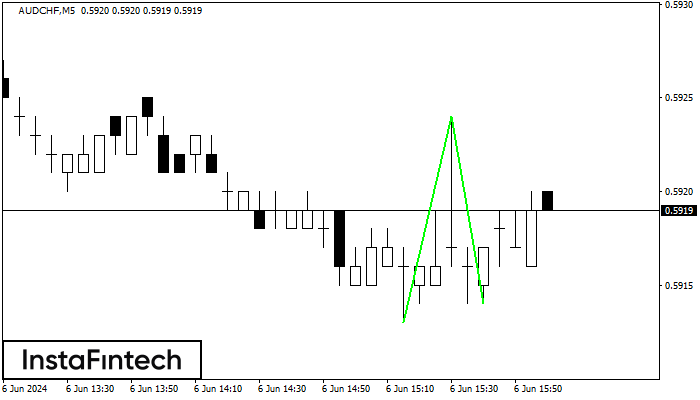
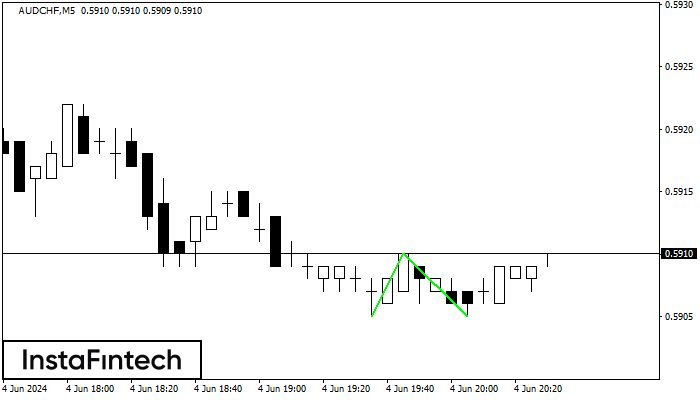
Double Bottom
The Double Bottom pattern has been formed on AUDCHF M5; the upper boundary is 0.5910; the lower boundary is 0.5905. The width of the pattern is 5 points. In case of a break of the upper boundary 0.5910, a change in the trend can be predicted where the width of the pattern will coincide with the distance to a possible take profit level.
AUDCHF M5
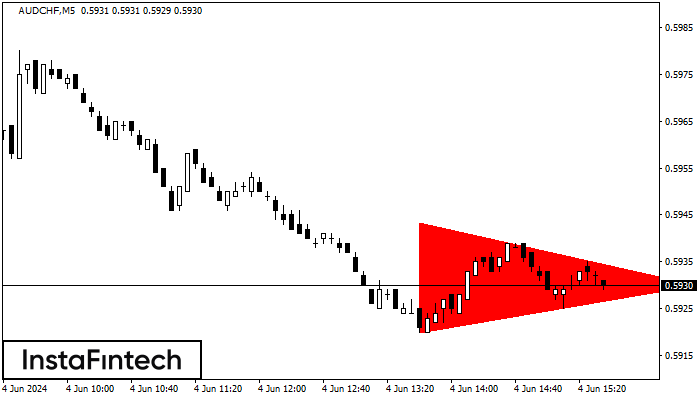
Bearish Symmetrical Triangle
According to the chart of M5, AUDCHF formed the Bearish Symmetrical Triangle pattern. Description: The lower border is 0.5920/0.5930 and upper border is 0.5943/0.5930. The pattern width is measured on the chart at -23 pips. The formation of the Bearish Symmetrical Triangle pattern evidently signals a continuation of the downward trend. In other words, if the scenario comes true and AUDCHF breaches the lower border, the price could continue its move toward 0.5915.
AUDCHF H1
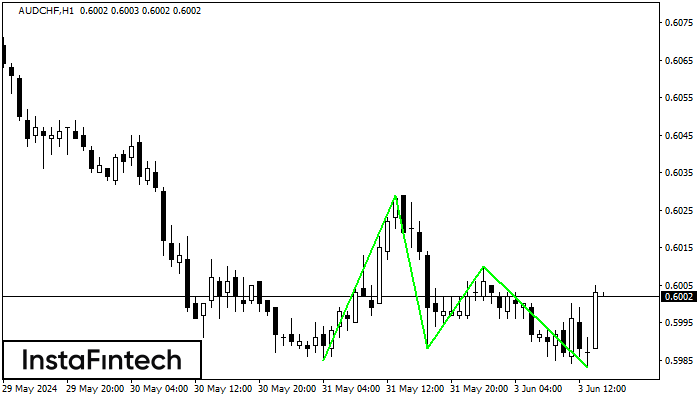
Triple Bottom
The Triple Bottom pattern has formed on the chart of the AUDCHF H1 trading instrument. The pattern signals a change in the trend from downwards to upwards in the case of breakdown of 0.6029/0.6010.
AUDCHF M15
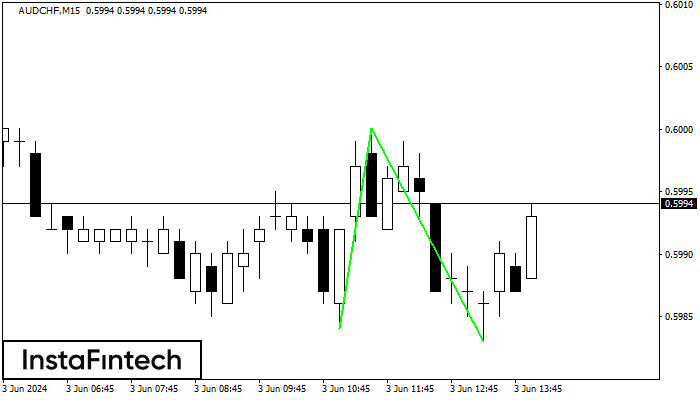
Double Bottom
The Double Bottom pattern has been formed on AUDCHF M15. This formation signals a reversal of the trend from downwards to upwards. The signal is that a buy trade should be opened after the upper boundary of the pattern 0.6000 is broken. The further movements will rely on the width of the current pattern 16 points.
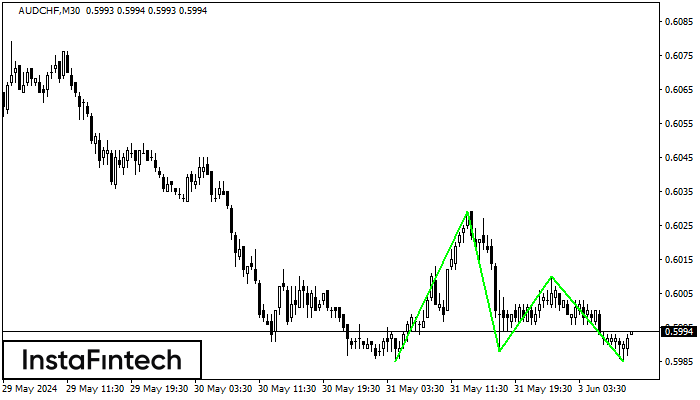
AUDCHF M30
Triple Bottom
The Triple Bottom pattern has formed on the chart of the AUDCHF M30 trading instrument. The pattern signals a change in the trend from downwards to upwards in the case of breakdown of 0.6029/0.6010.
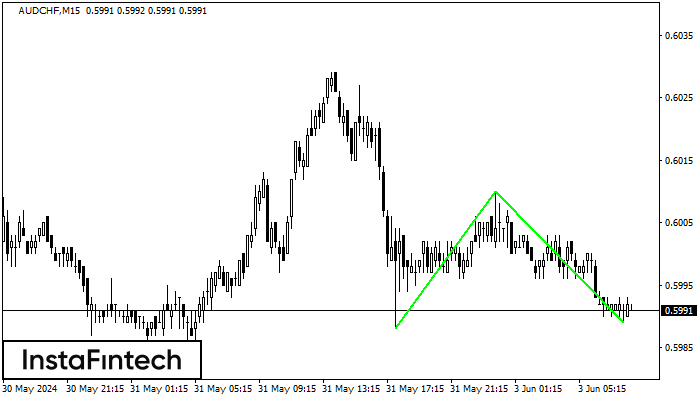
AUDCHF M15
Double Bottom
The Double Bottom pattern has been formed on AUDCHF M15. This formation signals a reversal of the trend from downwards to upwards. The signal is that a buy trade should be opened after the upper boundary of the pattern 0.6010 is broken. The further movements will rely on the width of the current pattern 22 points.