 Français
  Русский
 English
 Bahasa Indonesia
 Bahasa Malay
 ไทย
ไทย Español
 Deutsch
 Български
 Tiếng Việt
 中文
中文 বাংলা
বাংলা हिन्दी
 Čeština
 Українська
 Română
FX.co ★ Patterns #Bitcoin | Taux de change du Bitcoin sur le marché Forex

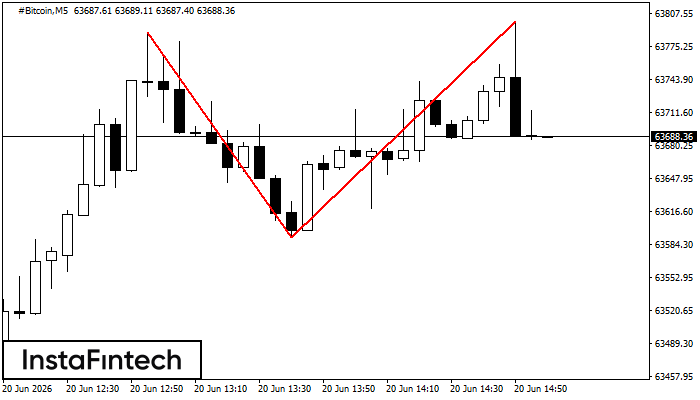
#Bitcoin M5
Double Top
On the chart of #Bitcoin M5 the Double Top reversal pattern has been formed. Characteristics: the upper boundary 63799.59; the lower boundary 63591.71; the width of the pattern 20788 points. The signal: a break of the lower boundary will cause continuation of the downward trend targeting the 63591.56 level.
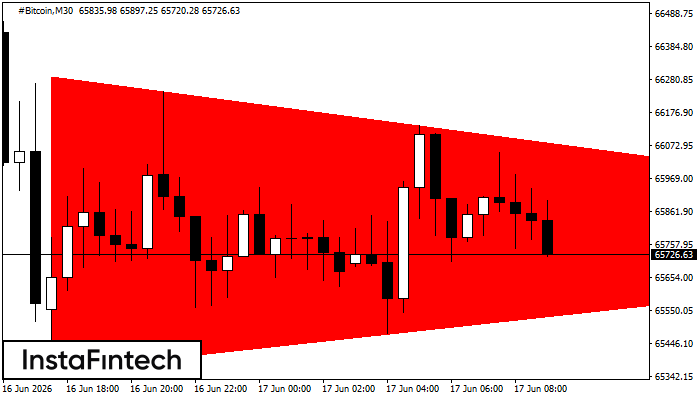
#Bitcoin M30
Bearish Symmetrical Triangle
According to the chart of M30, #Bitcoin formed the Bearish Symmetrical Triangle pattern. Trading recommendations: A breach of the lower border 65360.39 is likely to encourage a continuation of the downward trend.
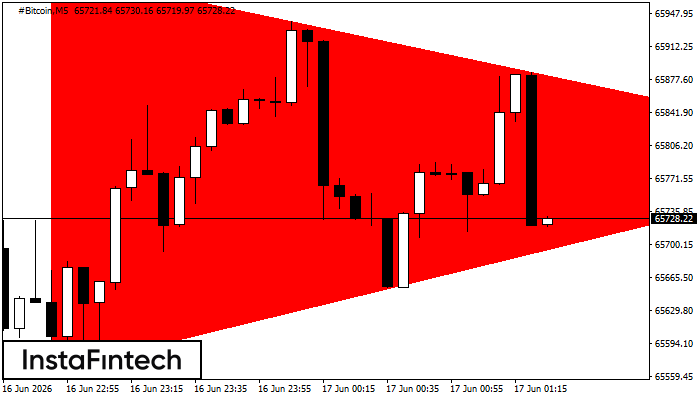
#Bitcoin M5
Bearish Symmetrical Triangle
According to the chart of M5, #Bitcoin formed the Bearish Symmetrical Triangle pattern. Trading recommendations: A breach of the lower border 65565.70 is likely to encourage a continuation of the downward trend.
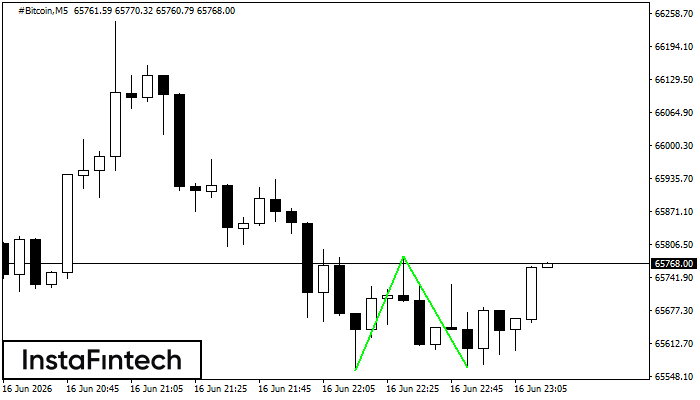
#Bitcoin M5
Double Bottom
The Double Bottom pattern has been formed on #Bitcoin M5; the upper boundary is 65781.74; the lower boundary is 65565.70. The width of the pattern is 22225 points. In case of a break of the upper boundary 65781.74, a change in the trend can be predicted where the width of the pattern will coincide with the distance to a possible take profit level.
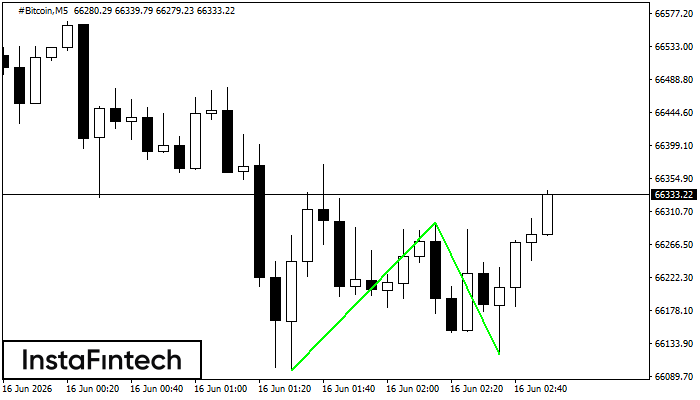
#Bitcoin M5
Double Bottom
The Double Bottom pattern has been formed on #Bitcoin M5. This formation signals a reversal of the trend from downwards to upwards. The signal is that a buy trade should be opened after the upper boundary of the pattern 66296.15 is broken. The further movements will rely on the width of the current pattern 19863 points.
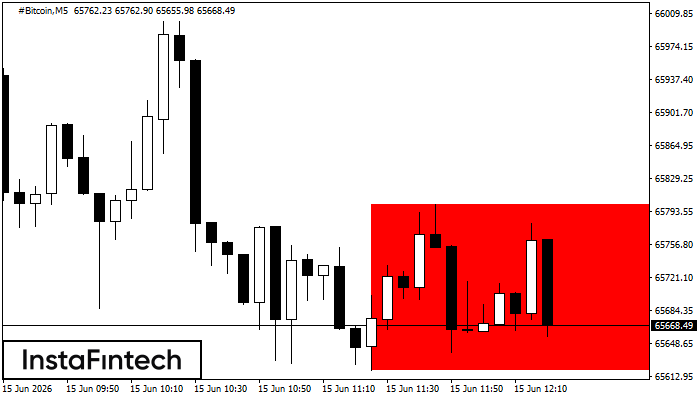
#Bitcoin M5
Bearish Rectangle
According to the chart of M5, #Bitcoin formed the Bearish Rectangle. This type of a pattern indicates a trend continuation. It consists of two levels: resistance 65800.79 - 0.00 and support 65619.39 – 65619.39. In case the resistance level 65619.39 - 65619.39 is broken, the instrument is likely to follow the bearish trend.
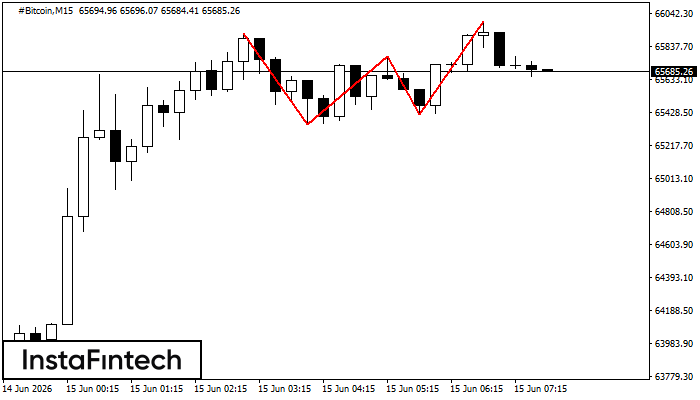
#Bitcoin M15
Triple Top
On the chart of the #Bitcoin M15 trading instrument, the Triple Top pattern that signals a trend change has formed. It is possible that after formation of the third peak, the price will try to break through the resistance level 65353.69, where we advise to open a trading position for sale. Take profit is the projection of the pattern’s width, which is 56727 points.
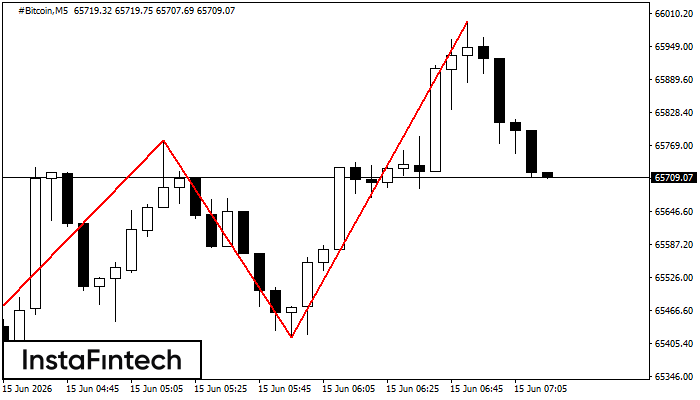
#Bitcoin M5
Triple Top
On the chart of the #Bitcoin M5 trading instrument, the Triple Top pattern that signals a trend change has formed. It is possible that after formation of the third peak, the price will try to break through the resistance level 65353.69, where we advise to open a trading position for sale. Take profit is the projection of the pattern’s width, which is 56727 points.
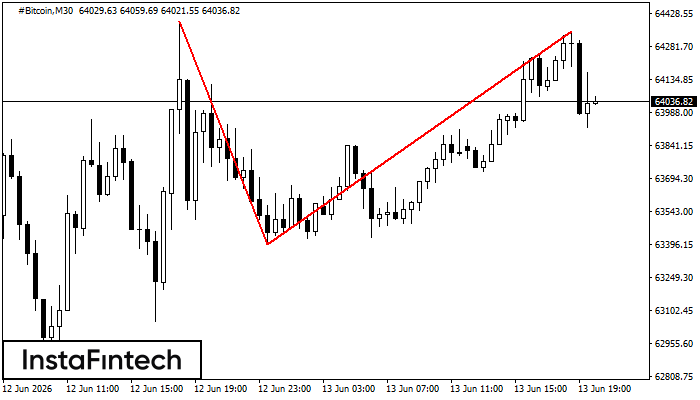
#Bitcoin M30
Double Top
On the chart of #Bitcoin M30 the Double Top reversal pattern has been formed. Characteristics: the upper boundary 64351.11; the lower boundary 63399.31; the width of the pattern 95180 points. The signal: a break of the lower boundary will cause continuation of the downward trend targeting the 63399.01 level.
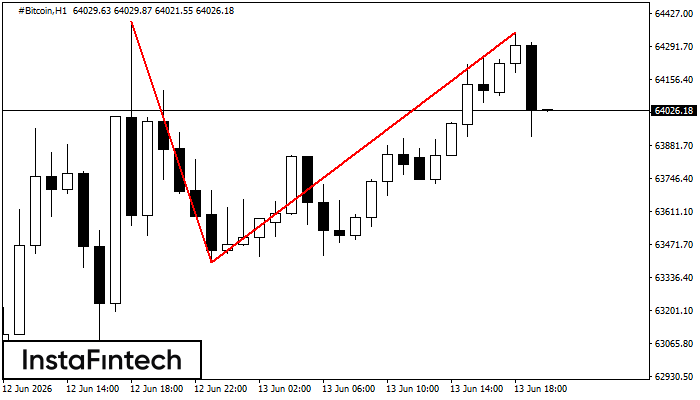
#Bitcoin H1
Double Top
On the chart of #Bitcoin H1 the Double Top reversal pattern has been formed. Characteristics: the upper boundary 64351.11; the lower boundary 63399.31; the width of the pattern 95180 points. The signal: a break of the lower boundary will cause continuation of the downward trend targeting the 63398.91 level.