 Français
 Русский
 English
 Bahasa Indonesia
 Bahasa Malay
 ไทย
ไทย Español
 Deutsch
 Български
 Tiếng Việt
 中文
中文 বাংলা
বাংলা हिन्दी
 Čeština
 Українська
 Română
FX.co ★ Patterns #EBAY | eBay Inc. Stock Price

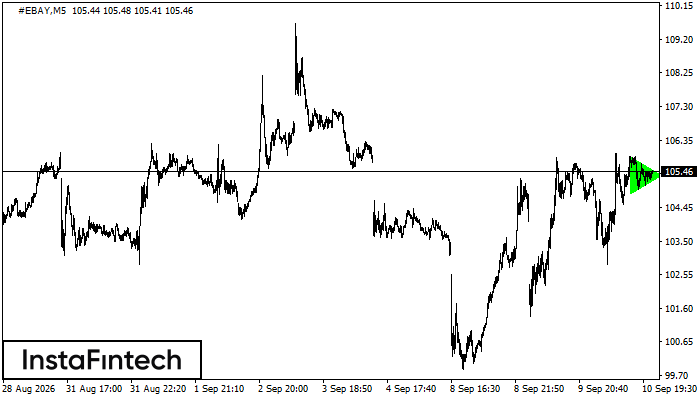
#EBAY M5
Triangle symétrique haussier
Sur le graphique M5, #EBAY a formé la figure « Triangle symétrique haussier », qui signale une poursuite de tendance. La limite supérieure passe par 105.89/105.34 et la limite inférieure par 104.84/105.34. La largeur de la figure est de 105 points. Dans une tendance haussière, la formation de « Triangle symétrique haussier » suggère la poursuite du mouvement. En cas de franchissement de 105.34, le cours pourrait évoluer vers 105.49.
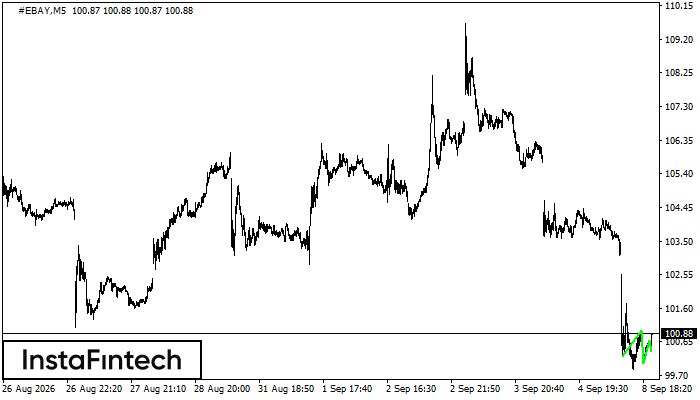
#EBAY M5
Triple creux
La figure « Triple creux » s’est formée sur le graphique #EBAY M5. La limite inférieure se situe à 100.37 et la limite supérieure passe par 100.96/100.69. La largeur projetée est de 92 points. La formation de « Triple creux » indique un possible retournement haussier. Si la résistance de confirmation à 100.96 est franchie, la hausse devrait se poursuivre.
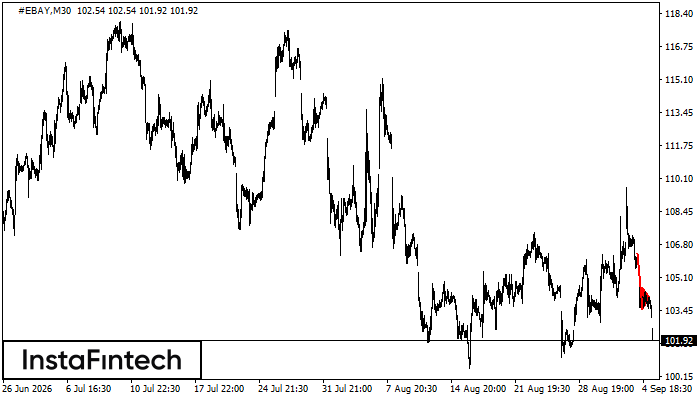
#EBAY M30
Fanion baissier
La figure « Fanion baissier » s’est formée sur le graphique #EBAY M30. Elle traduit une brève phase de ralentissement avant une possible reprise dans le sens de la tendance initiale. Une clôture sous le plus bas à 103.52 pourrait offrir une occasion de vente.
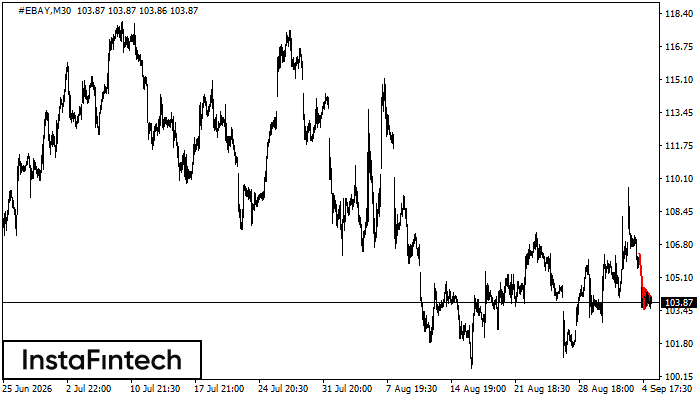
#EBAY M30
Fanion baissier
La figure « Fanion baissier » s’est formée sur le graphique #EBAY M30. La cassure du plus bas du fanion à 103.52 signalerait la poursuite de la tendance baissière. Recommandation : placer un ordre Sell Stop 10 points sous le plus bas de la figure et le Take Profit à une distance égale à la projection de la hauteur du mât.
#EBAY M15
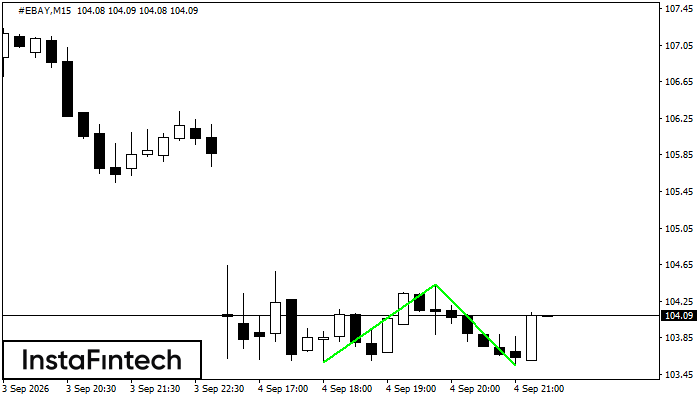
Double creux
La figure « Double creux » s’est formée sur #EBAY M15 et signale un retournement de la tendance baissière vers une tendance haussière. Une position longue peut être envisagée après le franchissement de la limite supérieure 104.43. La largeur actuelle de la figure, soit 85 points, sert à projeter l’amplitude du prochain mouvement.
#EBAY M5
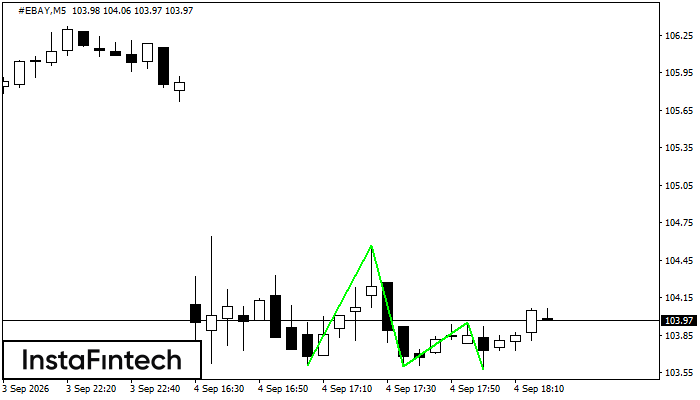
Triple creux
La figure « Triple creux » s’est formée sur le graphique #EBAY M5. Le franchissement de la résistance de confirmation à 104.57 pourrait signaler un retournement haussier.
#EBAY M5
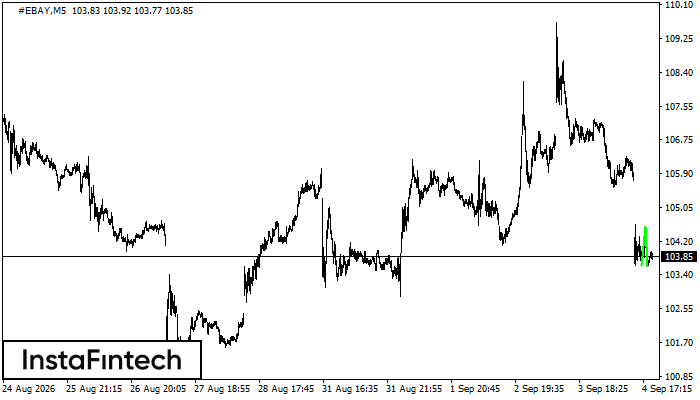
Double creux
La figure « Double creux » s’est formée sur #EBAY M5. La limite supérieure se situe à 104.57 et la limite inférieure à 103.60. Sa largeur est de 96 points. Le franchissement de la limite supérieure 104.57 pourrait signaler un retournement, la largeur de la figure servant à estimer la distance jusqu’au niveau de Take Profit.
#EBAY M15
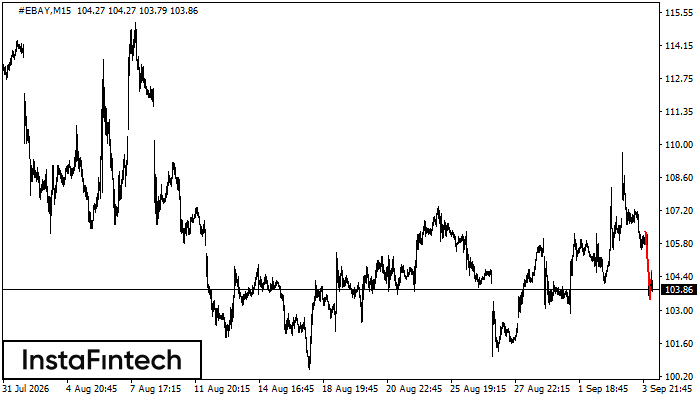
Drapeau baissier
La figure « Drapeau baissier » s’est formée sur le graphique #EBAY M15. La tendance baissière pourrait se poursuivre à court terme. Une position courte peut être envisagée après la cassure du plus bas à 103.43.
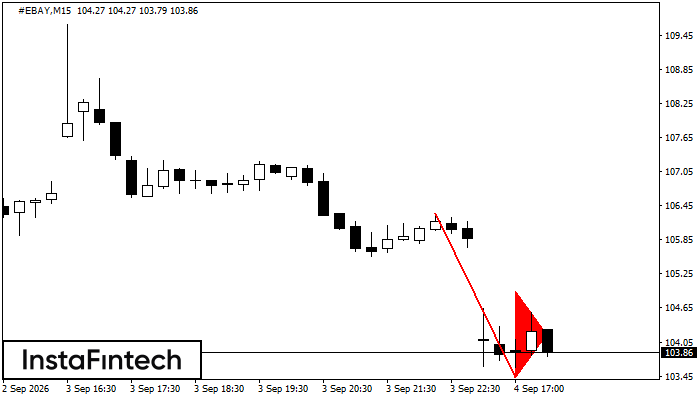
#EBAY M15
Fanion baissier
La figure « Fanion baissier » s’est formée sur le graphique #EBAY M15. La cassure du plus bas du fanion à 103.43 signalerait la poursuite de la tendance baissière. Recommandation : placer un ordre Sell Stop 10 points sous le plus bas de la figure et le Take Profit à une distance égale à la projection de la hauteur du mât.
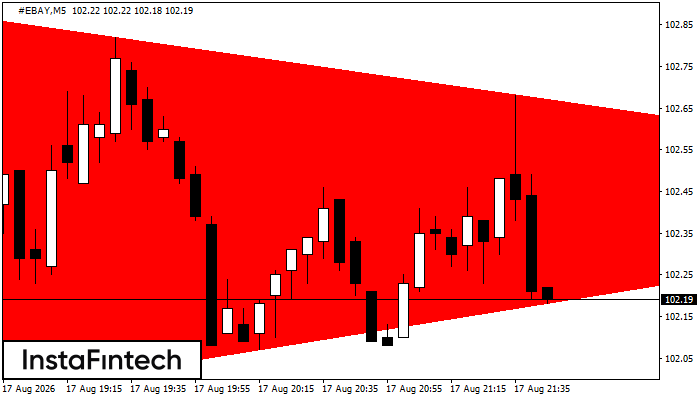
#EBAY M5
Triangle symétrique baissier
Sur le graphique M5, #EBAY a formé la figure « Triangle symétrique baissier ». Le franchissement de la limite inférieure à 101.94 signalerait une possible poursuite de la tendance baissière. Le mouvement potentiel correspond à la largeur de la figure, soit 95 points.