 Français
 Русский
 English
 Bahasa Indonesia
 Bahasa Malay
 ไทย
ไทย Español
 Deutsch
 Български
 Tiếng Việt
 中文
中文 বাংলা
বাংলা हिन्दी
 Čeština
 Українська
 Română
FX.co ★ Patterns EURJPY | Euro (EUR) to Japanese Yen (JPY) Rate in the Forex market

EURJPY M5
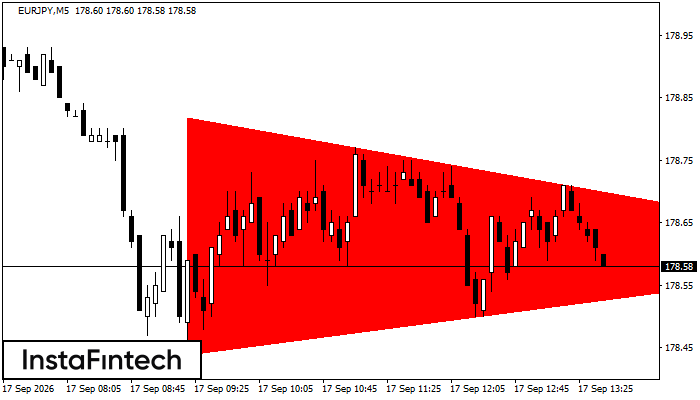
Triangle symétrique baissier
Sur le graphique M5, EURJPY a formé la figure « Triangle symétrique baissier ». Le franchissement de la limite inférieure à 178.44 signalerait une possible poursuite de la tendance baissière. Le mouvement potentiel correspond à la largeur de la figure, soit 38 points.
EURJPY M5
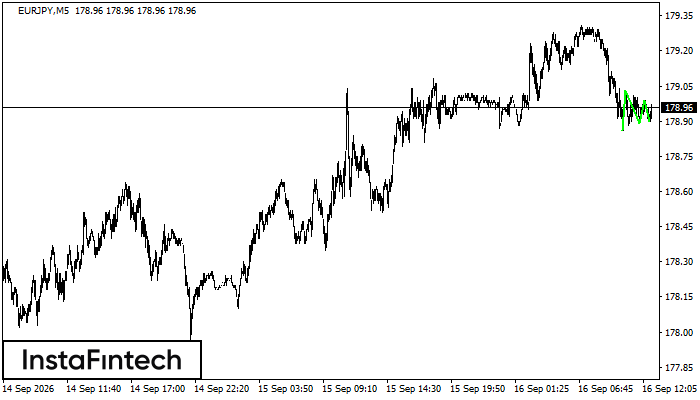
Triple creux
La figure « Triple creux » s’est formée sur le graphique EURJPY M5. Le franchissement de la résistance de confirmation à 179.03 pourrait signaler un retournement haussier.
EURJPY M5
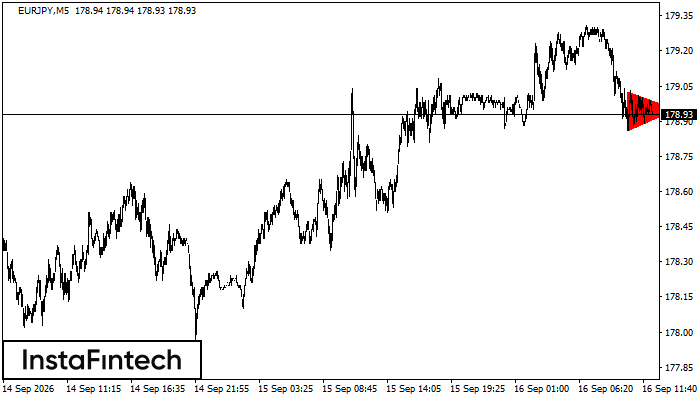
Triangle symétrique baissier
Sur le graphique M5, EURJPY a formé la figure « Triangle symétrique baissier ». Recommandation : le franchissement de la limite inférieure à 178.86 pourrait entraîner la poursuite de la tendance baissière.
EURJPY M5
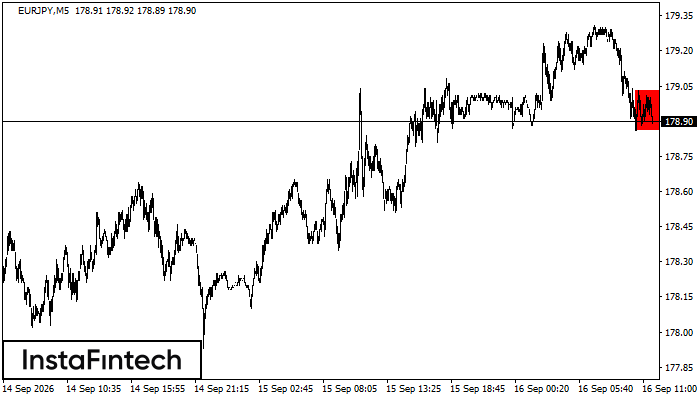
Rectangle baissier
Sur le graphique M5, EURJPY a formé la figure « Rectangle baissier », qui indique une poursuite de tendance. La limite supérieure se situe à 179.03 et la limite inférieure à 178.86. Une position courte peut être envisagée après une clôture sous la limite 178.86 de « Rectangle baissier ».
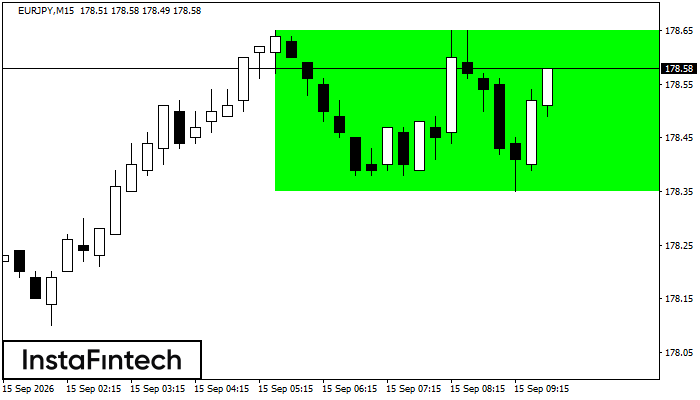
EURJPY M15
Rectangle haussier
Sur le graphique M15, EURJPY a formé la figure « Rectangle haussier », qui indique une poursuite de tendance. La limite supérieure se situe à 178.65 et la limite inférieure à 178.35. Le signal invite à envisager une position longue au-dessus de la limite supérieure 178.65 de « Rectangle haussier ».
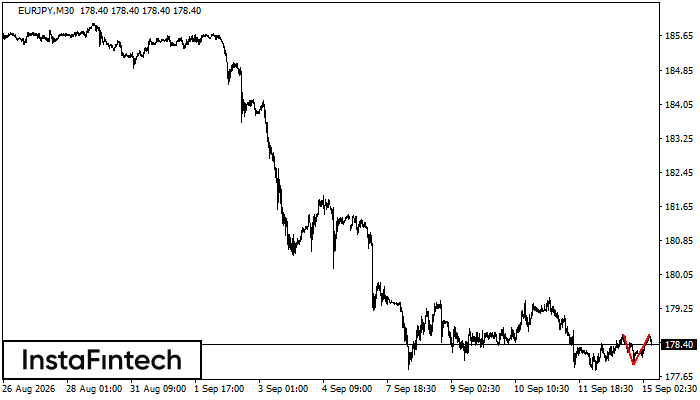
EURJPY M30
Double sommet
La figure de retournement « Double sommet » s’est formée sur le graphique EURJPY M30. La limite supérieure se situe à 178.65, la limite inférieure à 177.93 et la largeur est de 72 points. Le franchissement de la limite inférieure pourrait entraîner une poursuite de la baisse vers 177.63.
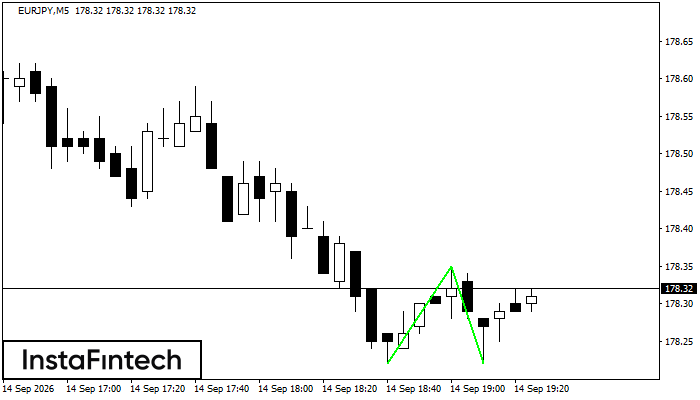
EURJPY M5
Double creux
La figure « Double creux » s’est formée sur EURJPY M5. La limite supérieure se situe à 178.35 et la limite inférieure à 178.22. Sa largeur est de 13 points. Le franchissement de la limite supérieure 178.35 pourrait signaler un retournement, la largeur de la figure servant à estimer la distance jusqu’au niveau de Take Profit.
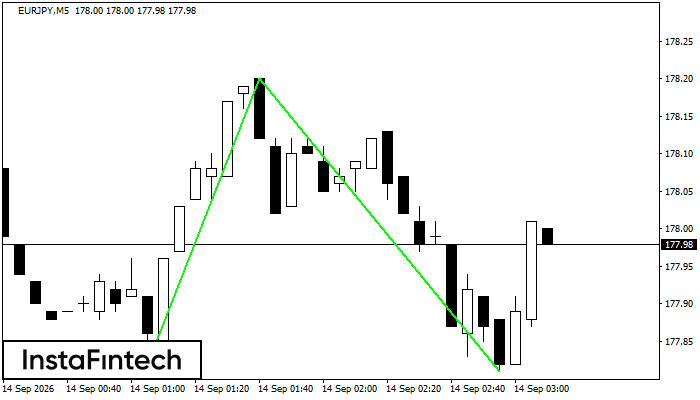
EURJPY M5
Double creux
La figure « Double creux » s’est formée sur EURJPY M5. La limite supérieure se situe à 178.20 et la limite inférieure à 177.81. Sa largeur est de 38 points. Le franchissement de la limite supérieure 178.20 pourrait signaler un retournement, la largeur de la figure servant à estimer la distance jusqu’au niveau de Take Profit.
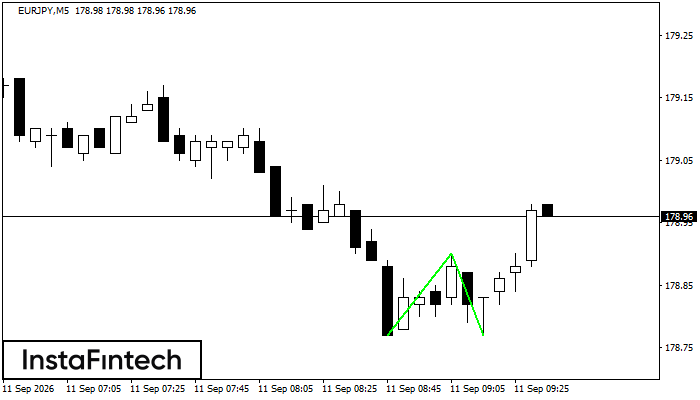
EURJPY M5
Double creux
La figure « Double creux » s’est formée sur EURJPY M5. La limite supérieure se situe à 178.90 et la limite inférieure à 178.77. Sa largeur est de 13 points. Le franchissement de la limite supérieure 178.90 pourrait signaler un retournement, la largeur de la figure servant à estimer la distance jusqu’au niveau de Take Profit.
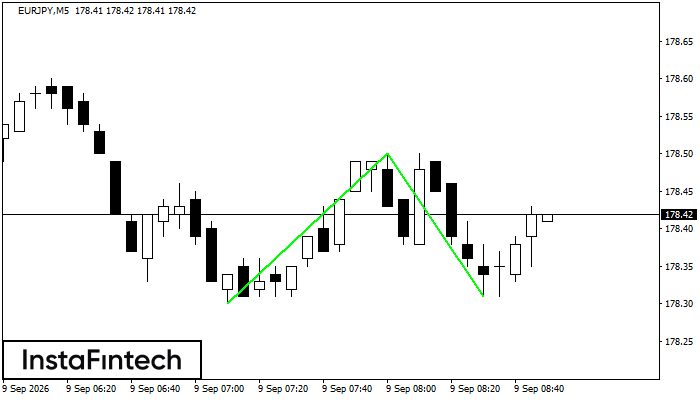
EURJPY M5
Double creux
La figure « Double creux » s’est formée sur EURJPY M5. Le support se situe à 178.30, la résistance à 178.50 et la largeur de la figure est de 20 points. Le franchissement de la résistance pourrait signaler un retournement, avec un premier objectif à une distance de 19 points.