 Français
  Русский
 English
 Bahasa Indonesia
 Bahasa Malay
 ไทย
ไทย Español
 Deutsch
 Български
 Tiếng Việt
 中文
中文 বাংলা
বাংলা हिन्दी
 Čeština
 Українська
 Română
FX.co ★ Patterns #FB | Facebook, Inc. Stock Price

#FB M5
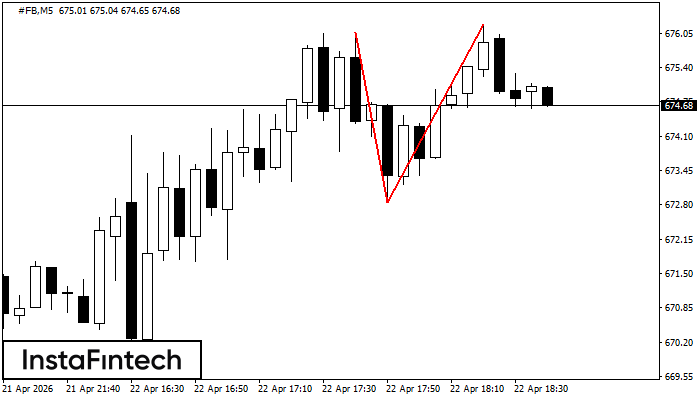
Double Top
On the chart of #FB M5 the Double Top reversal pattern has been formed. Characteristics: the upper boundary 676.21; the lower boundary 672.84; the width of the pattern 337 points. The signal: a break of the lower boundary will cause continuation of the downward trend targeting the 672.69 level.
#FB M5
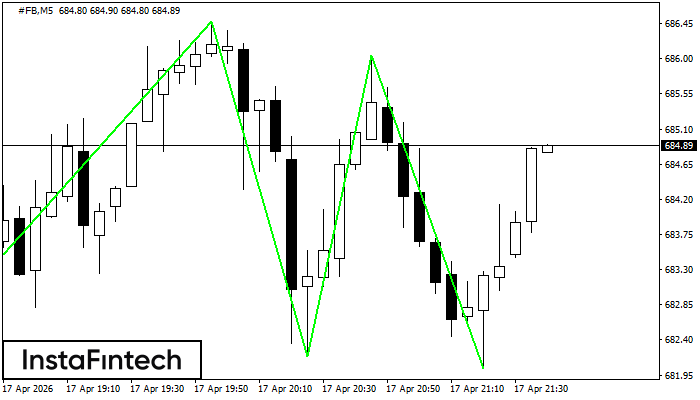
Triple Bottom
The Triple Bottom pattern has been formed on #FB M5. It has the following characteristics: resistance level 686.47/686.04; support level 681.90/682.04; the width is 457 points. In the event of a breakdown of the resistance level of 686.47, the price is likely to continue an upward movement at least to 682.34.
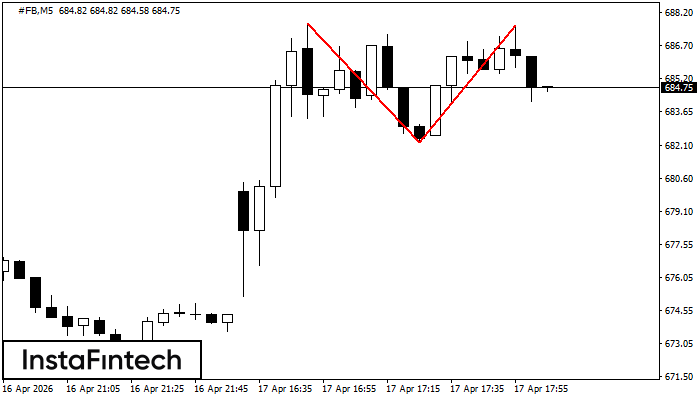
#FB M5
Double Bottom
The Double Bottom pattern has been formed on #FB M5. Characteristics: the support level 682.19; the resistance level 686.04; the width of the pattern 385 points. If the resistance level is broken, a change in the trend can be predicted with the first target point lying at the distance of 400 points.
#FB M5
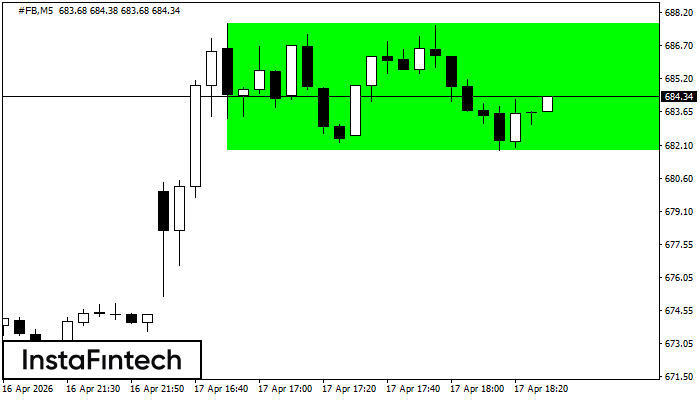
Bullish Rectangle
According to the chart of M5, #FB formed the Bullish Rectangle which is a pattern of a trend continuation. The pattern is contained within the following borders: the lower border 681.90 – 681.90 and upper border 687.71 – 687.71. In case the upper border is broken, the instrument is likely to follow the upward trend.
#FB M5
Double Top
The Double Top reversal pattern has been formed on #FB M5. Characteristics: the upper boundary 687.71; the lower boundary 682.27; the width of the pattern is 536 points. Sell trades are better to be opened below the lower boundary 682.27 with a possible movements towards the 682.12 level.
#FB M15
Bullish pennant
The Bullish pennant pattern is formed on the #FB M15 chart. It is a type of the continuation pattern. Supposedly, in case the price is fixed above the pennant’s high of 689.46, a further uptrend is possible.
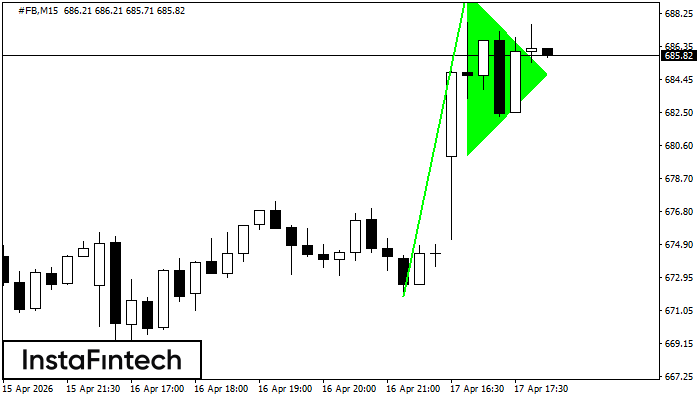
#FB M15
Bullish pennant
The Bullish pennant graphic pattern has formed on the #FB M15 instrument. This pattern type falls under the category of continuation patterns. In this case, if the quote can breaks out high, is expected to continue the upward trend to level 632.84.
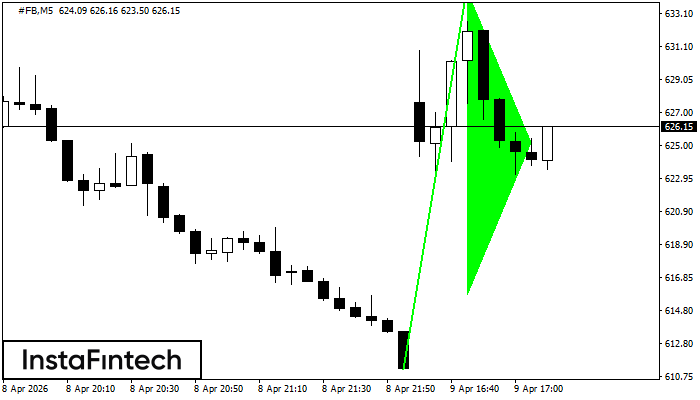
#FB M5
Bullish pennant
The Bullish pennant signal – Trading instrument #FB M5, continuation pattern. Forecast: it is possible to set up a buy position above the pattern’s high of 634.55, with the prospect of the next move being a projection of the flagpole height.
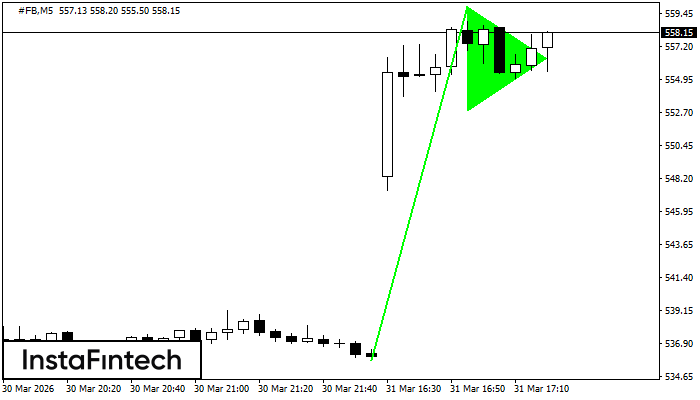
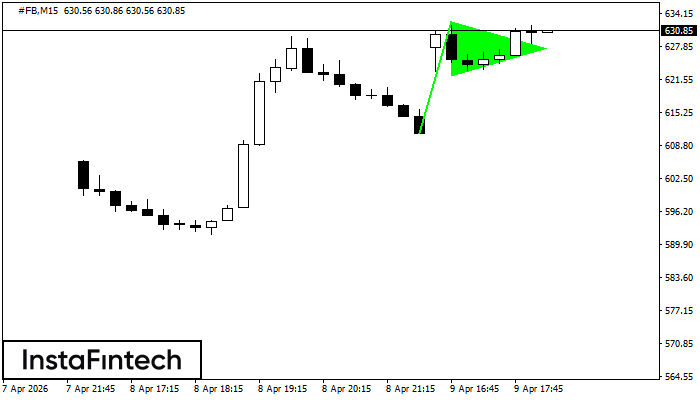
#FB M5
Bullish pennant
The Bullish pennant graphic pattern has formed on the #FB M5 instrument. This pattern type falls under the category of continuation patterns. In this case, if the quote can breaks out high, is expected to continue the upward trend to level 560.08.
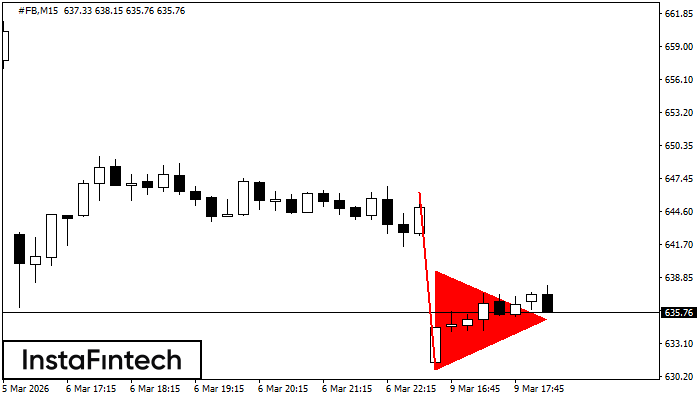
#FB M15
Bearish pennant
The Bearish pennant pattern has formed on the #FB M15 chart. This pattern type is characterized by a slight slowdown after which the price will move in the direction of the original trend. In case the price fixes below the pattern’s low of 630.85, a trader will be able to successfully enter the sell position.