 Français
  Русский
 English
 Bahasa Indonesia
 Bahasa Malay
 ไทย
ไทย Español
 Deutsch
 Български
 Tiếng Việt
 中文
中文 বাংলা
বাংলা हिन्दी
 Čeština
 Українська
 Română
FX.co ★ Patterns GOLD | Taux de l'or sur le marché Forex

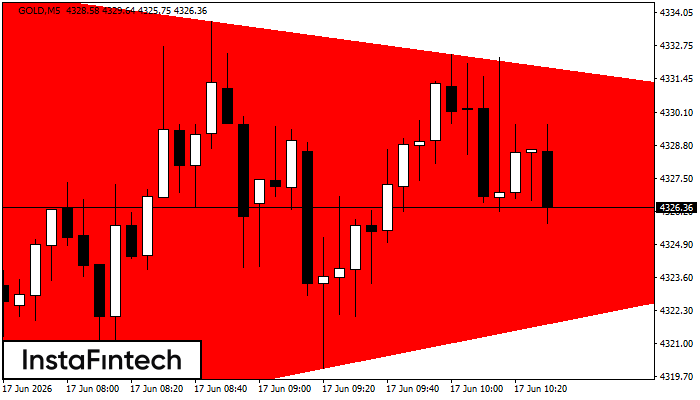
GOLD M5
Bearish Symmetrical Triangle
According to the chart of M5, GOLD formed the Bearish Symmetrical Triangle pattern. This pattern signals a further downward trend in case the lower border 4317.26 is breached. Here, a hypothetical profit will equal the width of the available pattern that is -1775 pips.
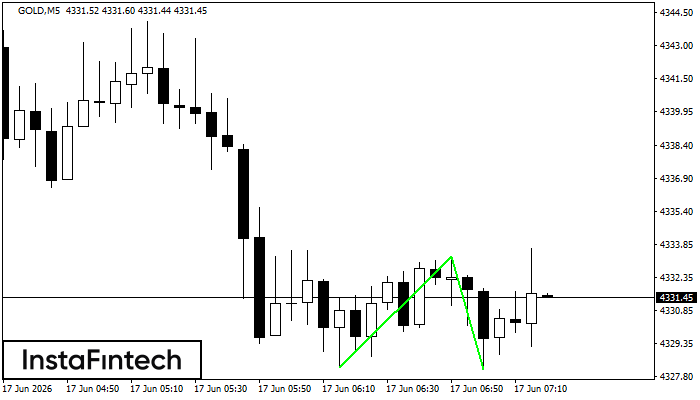
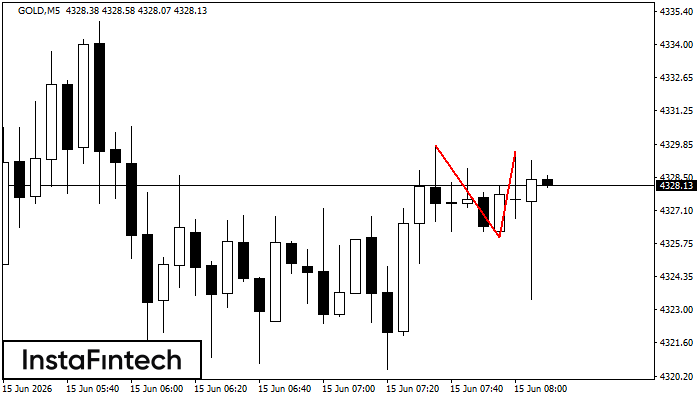
GOLD M5
Double Bottom
The Double Bottom pattern has been formed on GOLD M5; the upper boundary is 4333.30; the lower boundary is 4328.14. The width of the pattern is 508 points. In case of a break of the upper boundary 4333.30, a change in the trend can be predicted where the width of the pattern will coincide with the distance to a possible take profit level.
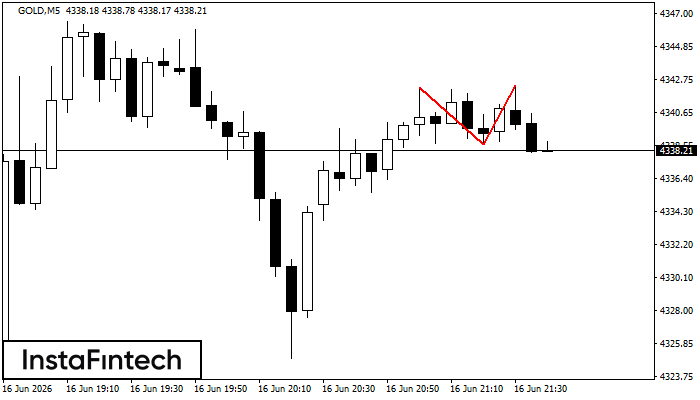
GOLD M5
Double Top
On the chart of GOLD M5 the Double Top reversal pattern has been formed. Characteristics: the upper boundary 4342.40; the lower boundary 4338.60; the width of the pattern 380 points. The signal: a break of the lower boundary will cause continuation of the downward trend targeting the 4338.45 level.
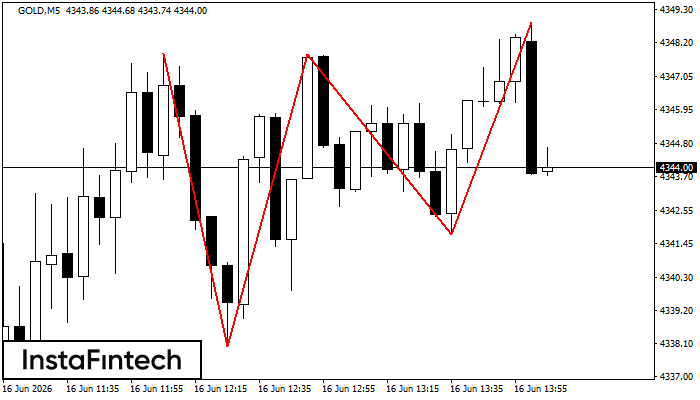
GOLD M5
Triple Top
On the chart of the GOLD M5 trading instrument, the Triple Top pattern that signals a trend change has formed. It is possible that after formation of the third peak, the price will try to break through the resistance level 4337.99, where we advise to open a trading position for sale. Take profit is the projection of the pattern’s width, which is 985 points.
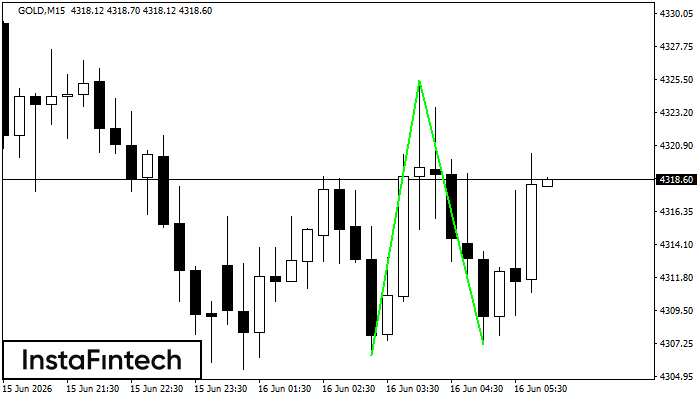
GOLD M15
Double Bottom
The Double Bottom pattern has been formed on GOLD M15; the upper boundary is 4325.41; the lower boundary is 4307.15. The width of the pattern is 1900 points. In case of a break of the upper boundary 4325.41, a change in the trend can be predicted where the width of the pattern will coincide with the distance to a possible take profit level.
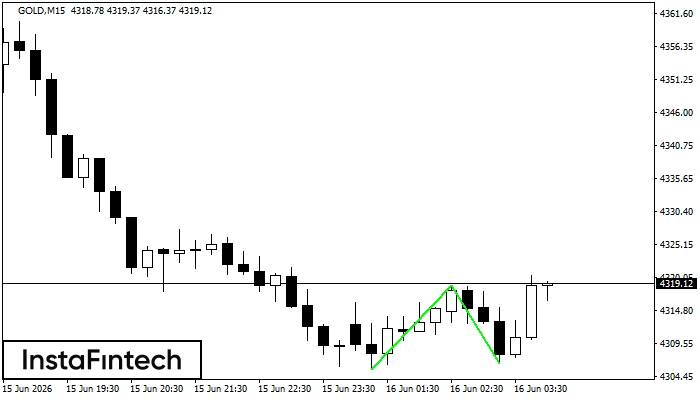
GOLD M15
Double Bottom
The Double Bottom pattern has been formed on GOLD M15. This formation signals a reversal of the trend from downwards to upwards. The signal is that a buy trade should be opened after the upper boundary of the pattern 4318.76 is broken. The further movements will rely on the width of the current pattern 1330 points.
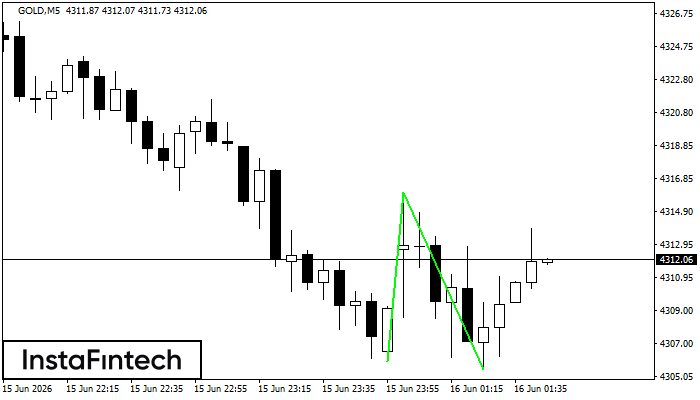
GOLD M5
Double Bottom
The Double Bottom pattern has been formed on GOLD M5. Characteristics: the support level 4305.96; the resistance level 4316.04; the width of the pattern 1008 points. If the resistance level is broken, a change in the trend can be predicted with the first target point lying at the distance of 1058 points.
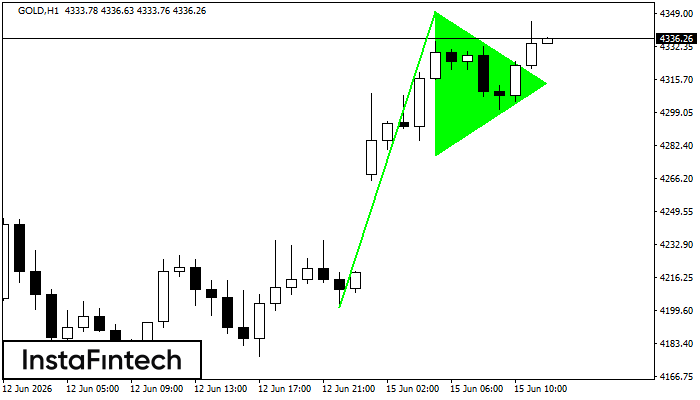
GOLD H1
Bullish pennant
The Bullish pennant signal – Trading instrument GOLD H1, continuation pattern. Forecast: it is possible to set up a buy position above the pattern’s high of 4349.80, with the prospect of the next move being a projection of the flagpole height.
GOLD M5
Double Top
The Double Top pattern has been formed on GOLD M5. It signals that the trend has been changed from upwards to downwards. Probably, if the base of the pattern 4326.00 is broken, the downward movement will continue.
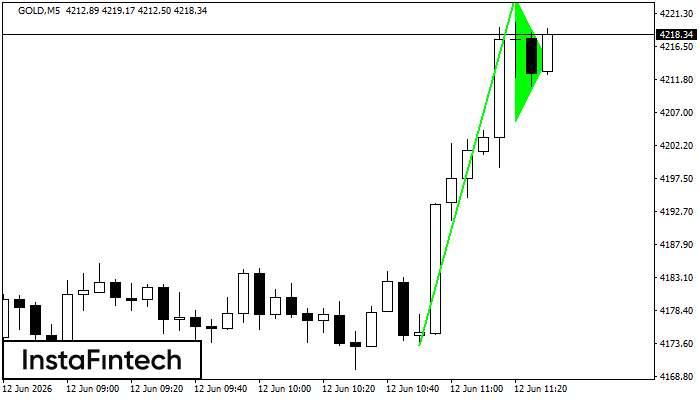
GOLD M5
Bullish pennant
The Bullish pennant signal – Trading instrument GOLD M5, continuation pattern. Forecast: it is possible to set up a buy position above the pattern’s high of 4223.57, with the prospect of the next move being a projection of the flagpole height.